
Tweet
December 18, 2014
Proceedings of the Natural Institute of Science | Volume 1 | HARD 9
The truth about Santa’s beer: An experimental test of holiday beer appeal
Eirik Sjåholm Knudsen1,2, Lasse B. Lien1,3
1 - NHH Norwegian School of Economics
2 - eirik.knudsen_at_nhh.no
3 - lasse.lien_at_nhh.no

Introduction
The economics literature, while admittedly useful for several purposes, has all but ignored a key economic problem arising annually in late December. We are of course, referring to the choice of one’s Christmas beer. This important issue has either been left to amateurish investigations by journalists, chefs, celebrities or so called “experts”. Typically, these “experts” design their tests to maximize the ability to detect variation in flavor across products available in the market. We know, of course, that taste is not exogenous, and furthermore that maximizing internal validity (e.g., testing from plastic cups in a sterile laboratory setting, wearing a white coat, etc.) risks destroying external validity and therefore is of little use to the typical Christmas beer consumer. The typical Christmas beer consumer is more likely to wear a reindeer sweater, consume the product in their (or a friend’s) living room, drink from a less than perfectly clean glass, all while listening to Crosby (1945) on the radio. We also suspect that the “expert” testers often either fail to swallow the product, or spread the testing period over several days. The typical consumer, on the other hand, tends to over-consume the product over a period of a few hours, and then resist the product for a couple of days thereafter.
We have taken it upon ourselves to conduct an experimental test that maximizes external validity, even if this involves some (quite trivial) sacrifice of internal validity. Our test recreates the typical setting where the product is used, that is, in the living room of one of the authors. The strategy used to recruit test subjects is perhaps best described as convenience sampling. This means that one of the authors[1] invited people occupying high positions on the “recent calls” list on his iPhone. There appears to have been some nonrandom loss of testers during this process as we ended up with a panel without any variation in sex (all males) or level of education[2]. At first we considered this as a threat to generalizability, but then we realized that having only one gender slightly simplified our statistical model. So, we decided this should rather be considered a strength.
We tested 50 different Christmas beers (a list of beers is available in the Appendix). Although more beers would have given us additional statistical power, health and safety concerns made us conclude that it would be unethical to include additional beers. Contrary to traditional “expert tests” we allowed the test subjects to see the design of the container, read the label, and pour the beer themselves, because the marketing literature suggests that such stuff matters (Marketing 1976) and allowing this is therefore likely to increase external validity. All 50 beers were tested during a test period of 8:36 hours.
The testers scored each beer individually on the utility (an economics term describing how happy something makes you) of consuming each type of beer (every stimuli included) on a scale of 1 - 10. Testers were unaware of the score of the other testers when giving their own score. In retrospect we acknowledge that this feature suppresses group think and herding behavior, which we think would be heavily present under normal circumstances (Organization 1983). We think this lowers external validity, and accordingly we regret this decision. The scores were then summarized to a total score for each beer type (Cronbach’s Alpha = 0.95), and the scores were finally multiplied by 10/7 to form a 10 - 100 scale. This maximizes comparability with other tests. Our analysis examines the contribution of different characteristics to this total score. Except where we deviate grotesquely from the experimental ideal, we remained as close to the classical experiment as possible. The order of testing was for example random[3].
The remainder of this paper is structured as follows: first we present our findings, then we conclude[4].
Hypotheses
Deriving hypotheses from existing literature is somewhat difficult, because in our introduction to this paper we identified such a deep and wide gorge in the existing literature that we do not have much to work with (incidentally, we think this lack of founding in the literature merely shows the seminal nature of our contribution). However, we have identified a few relevant precursors and, thus, suggest five hypotheses.
One source of information is the hipster literature. Hipsters favor what the majority of consumers do not like, but will come to like in the future (which will then force the hipster to change his/her preferences) (Anthropology 2001). We therefore feel that the hipster literature can be used as a reverse indicator of what the general public will like. The hipster literature has argued that micro brewed beers - preferably so micro brewed that the tester is the only one who has ever heard of the beer - is positively correlated with overall beer rating. This should indicate (by negative implication) that the general public dislikes micro brewed beers. The hipster literature further argues that the beer should be micro brewed in a foreign country that very few have heard of, except perhaps the hipster him/herself (Brûlé forthcoming). This leads us to suspect that the general public favors domestic beers, and also that this should make their utility from a micro brewed beer higher.
H1: Micro brewed correlates negatively with consumer utility
H2: The interaction between micro brewed and domestic is positively signed
Other literature that focuses on beer drinking is the student literature. In this literature the implicit preference conveyed is that alcohol content is the dominant correlate of utility. Obscurity, as emphasized in the hipster literature, is regarded as completely dominated by alcohol content. Our test subjects are all former students. Research has shown that preferences and behavior are very difficult to change, once established (Psychology 1965). Based on this inertia of preferences we predict that alcoholic content remains a strong and positive predictor of utility, even after graduation. The other (and more explicit) claim in the student literature is that beer is too expensive. We interpret this as an indication that price is a negative correlate of utility among students. Generalizing this to the general public is not as straight forward as with other preferences. Research shows that as consumers become wealthier, they become less sensitive to price relative to other features (Economics 1891). Our subjects are no longer students, but not vulgarly rich either[5]. Though we admit now to being a bit confused, we still think that price remains a negative correlate of utility, but perhaps less influential than the student literature claims.
H3: Alcohol content correlates positively with higher consumer utility
H4: Price per liter correlates negatively with higher consumer utility
Finally, we have the marketing literature. This literature has made the daring leap to include the outside of the bottle, and the shape of the bottle itself. If the design is clever enough, then people will drink and enjoy just about anything (Marketing 1976). Unfortunately, the marketing literature is somewhat superficial on the subject of Christmas, but the general thrust of the marketing literature is to include things that people like. We would therefore expect things like snow, Santa, Christmas trees, and the color red on the label to be positively correlated with utility.
H5: Nice Christmas stuff on the label correlates positively with higher consumer utility
Statistical Analysis
Based on our hypotheses and some hitherto undiscussed control variables, the utility of drinking beer i will be given by the following equation:
Utility_scorei = α1 + β1microi + β2domestici + β3strongi + β4very_strongi + β5pricei + β6Santai + β7snowi + β8redi + β9treei + β10Xi + εi
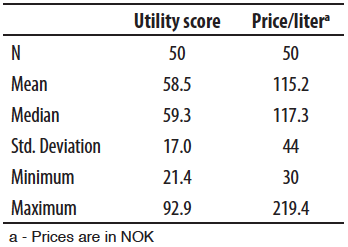
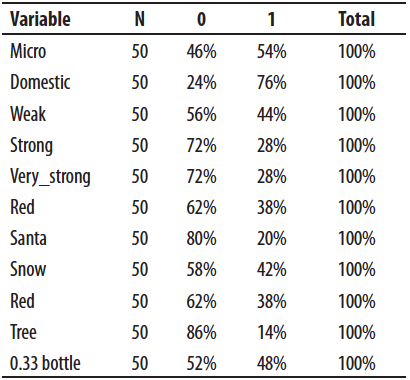
Utility score is our dependent variable. In total we have 9 independent variables. Micro is a binary variable indicating whether brand i is micro brewed (1) or not (0). Domestic is also a binary variable, taking the value 1 if brand i is domestic (in Norway), else it is 0. To measure alcohol content we divide the beers into three categories: weak (< 5%), strong (5-7%) and very strong (7-10%). Strong and very_strong are included in the model as binary variables[6]. Price is the price per liter of brand i. Finally, we have four binary variables indicating marketing stuff: the presence of Santa, snow, the color red, and a Christmas tree on the label of the bottle or can.
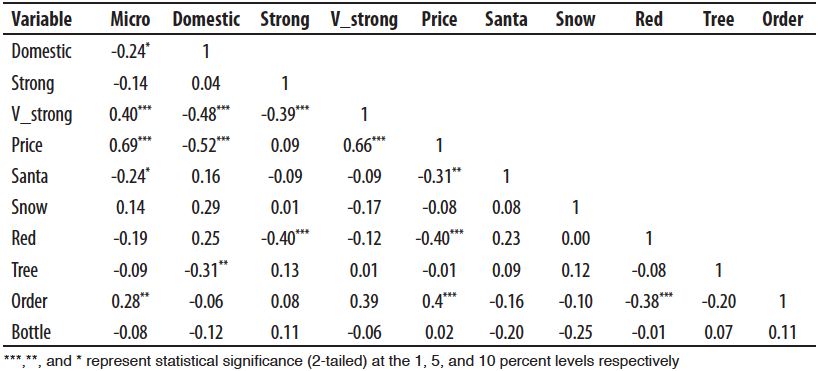
We also include a vector of control variables Xi to mitigate omitted variable bias. These include the order of testing and bottle size 0.33 liter (binary). Descriptive statistics of our variables are presented in Table 1 and 2, while the correlations of the independent and control variables are presented in Table 3.
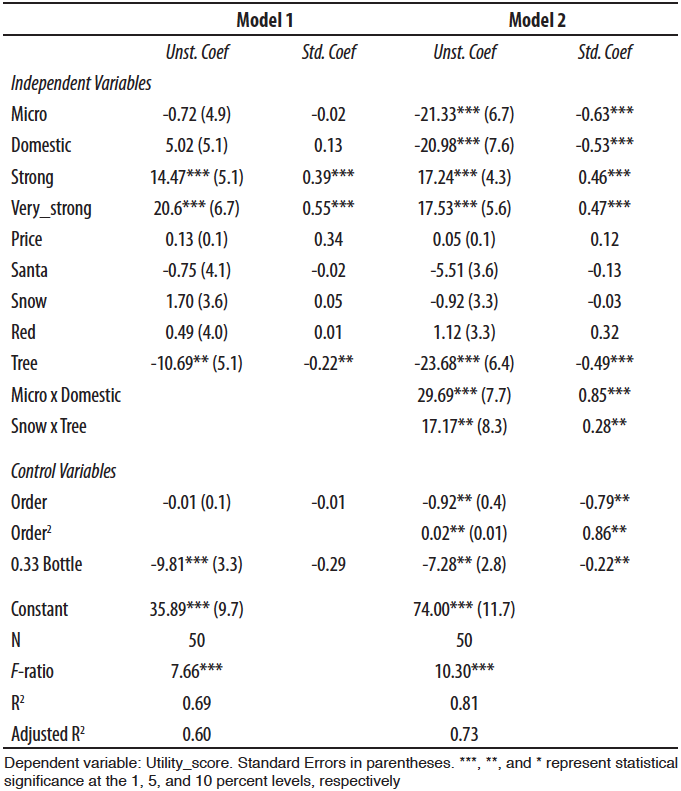
In addition, we construct three sets of interaction terms. The first is between micro and domestic, the second is between snow and Christmas tree, and the third is a squared term for order of testing. The first of these terms is designed to test hypothesis 2 and the second to test hypothesis 5. The third interaction term is included to test for nonlinearities in the effect of order of testing. This is done to eliminate the possibility that the confounding effects of intoxication of test subjects follow a nonlinear function. We therefore run two models, one without the interaction terms (Model 1) and one with the interaction terms (Model 2). The results of the regressions are presented in Table 4.
Results and Discussion
As seen in model 1 of Table 4 the main effect of micro is negative, but insignificant. This fails to support H1. Hypothesis 2 predicted a positive interaction effect between domestic and micro. As we can see from model 2 of Table 4, this interaction effect is indeed significantly positive. The starkest implication of this is that hipsters should stay away from micro brewed beers, particularly domestic ones, or face the risk of becoming aligned with the general public[7].
We derived H3 from the student literature, bolstered by psychology, to predict that alcoholic content would be positively signed. As seen in Model 1 of Table 4, both strong and very_strong are positive and significant, and also that very_strong has a higher standardized coefficient than strong. This thus supports H3. However, price is positive, but insignificant. So our confusion about this variable turned out to be spot on.
The marketing literature predicted that marketing stuff would matter. We find support for this hypothesis, but that the marketing literature is a bit superficial. The main effect of Christmas tree is negative, but if interacted with snow it becomes significantly positive. So consumers do not like a Christmas tree in splendid isolation on the label, but if combined with snow it predicts higher consumer utility. However, the color red and Santa did not help, revealing that more is not necessarily better. Consumers are able to see through cheap attempts to pile on Christmas symbols indiscriminately. But a tasteful, snowy Christmas tree is appreciated (example here). Having either one alone is not enough to evoke the Christmas spirit.
Among the control variables, the most interesting finding is that test order is related to utility in a quadratic function of the form: β2X2 - β1X. This means that the more test subjects drink, the worse test scores, until a point where scores start increasing again. We can identify this pattern in one of the subjects’ tasting notes: beer number 4 (of 50): “This one tastes like pear ice cream. Yummy!”, beer number 27: “I feel a bit groggy, are we done soon?” beer number 49: “Yihaa…[indecipherable]”. We find it hard to believe that the trend would remain positive indefinitely, but rather it should at some point turn negative again. More beers than the 50 included in our test would be needed to identify the cubic pattern this suggests.
Finally we’d like to draw attention to the explanatory power of our models (adjusted R2). The adjusted R2 of Model 1 is 0.60. Including the interaction terms (Model 2) increases the adjusted R2 to 0.73 (a personal best for the present authors!). We do realize that we may have capitalized a bit on chance here, but we still think it’s pretty cool.
Conclusion
This paper has opened up a new and important subfield of economics: Christmas beer investment and consumption. Drawing on almost all the social sciences (anthropology, marketing, organization theory, psychology and economics) we have shown that consumers like domestic micro brewed beers, with high alcohol content, and a snowy Christmas tree on the label. The external validity of our design is a distinctive strength. Internal validity is something only experimental economists care about, anyway.
Future research should extend and/or test our findings in different contexts. For example to settings where Christmas is unlikely to be snowy – the southern hemisphere comes to mind. It cannot be ruled out that palms and sand might be substitutes for spruce/pine trees and snow in this part of the world.
Another important extension is to include female testers. We have no idea how to achieve this, but female researchers would perhaps not face the same unsurmountable obstacles in recruitment.
Further, we admit that our research agenda is a bit Christian-centric. Other religions have other holidays, and probably other festive beers. Do our findings extend to these settings? What about religions that prohibit consumption of alcohol altogether? Does this reverse the effect of alcohol content?
In closing this paper we humbly point out that our findings raise more questions than answers, as great research always does. As with all great studies, more research is clearly needed.
Acknowledgments
We would like to thank K Gundersen, A Gausdal, O Bendiksen, A Hammersland, E W Furunes and P Ness for indispensable assistance with data collection, and two anonymous PNIS-reviewers for suggestions and comments.
References
Anthropology, Robinson C. (2001). Living on Hipster Island. Journal of Strange People with Strange Habits. 34(9): 23-912.
Brûlé, Creme (Forthcoming). Observations. Monocles (forthcoming issue)
Economics, Barter (1891). The Wealth of Nerds. London: Willey
Marketing, Baloney D. (1976). Why people buy stuff. Journal of Marketing 63 (4): 23-23,5.
Organization, Studies. 1983. “Why the cite in the text is entirely justified”. Chapter 4 in Cheney, D. and Bieber J. (eds.). Group think and herd behavior would indeed be present under those circumstances. Boston: Random Building.
Psychology, Ihairvo I. Ses (1965). I have never liked preference stability and I never will. Journal of Light Neurotics 27 (5): 86-96.
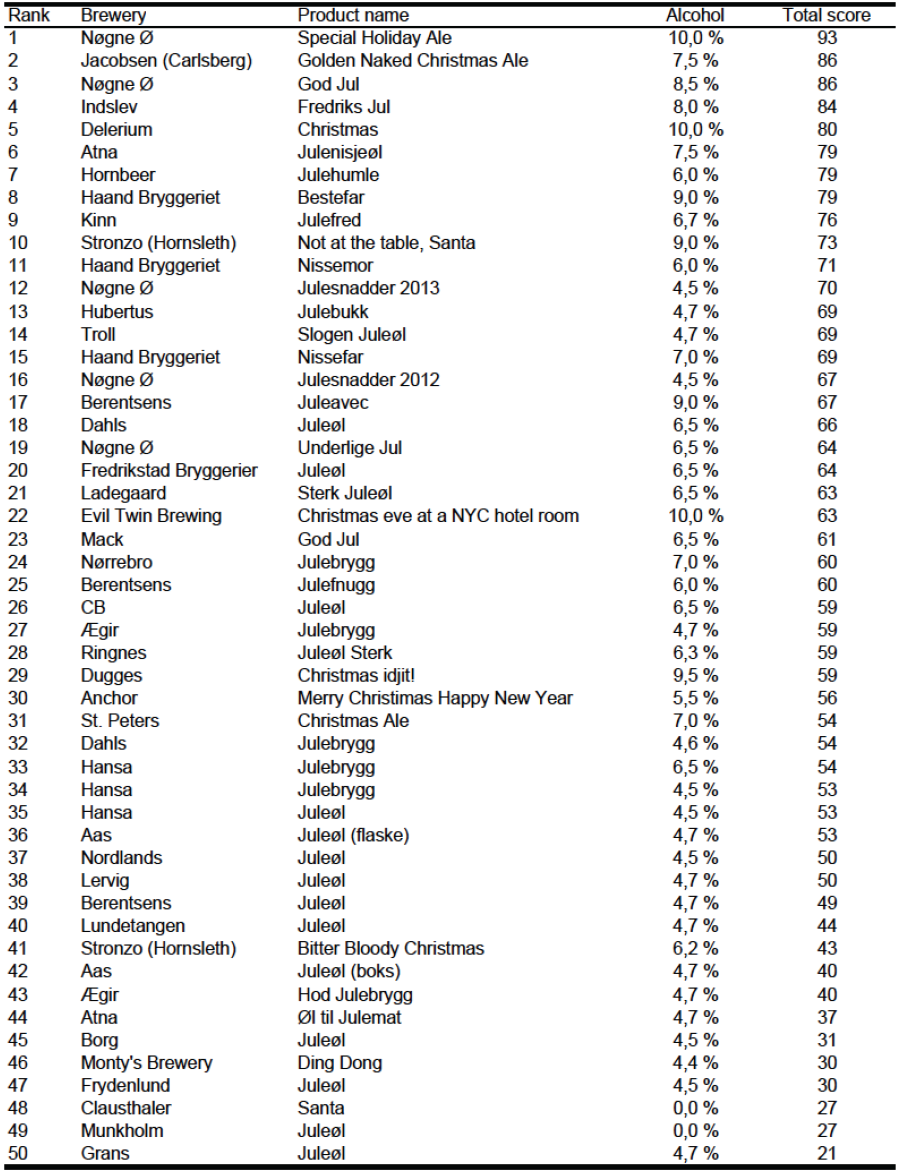
Appendix
Christmas beers in the test (ranked by Total Score)
Footnotes
[1] We like to refrain from identifying this author, as the other author is still offended for not being included among the testers. [Return to main text]
[2] While we had little variation on the level of education, we feel that we had such great variation in the type of education that we should be forgiven for the lack of low educated subjects. We had one economist, one statistician, one mathematician, one engineer, one law degree, one architect, and one subject with both a law and business degree. [Return to main text]
[3] Well, sort of random. Each tester just randomly grabbed a beer when the former beer was empty. And so on, until there were no beers left. [Return to main text]
[4] We forgot to mention that we first develop hypotheses. [Return to main text]
[5] Note that the state of not being a student, but not filthy rich either is quite common in the general public. [Return to main text]
[6] Norway has this rather unconventional law that says that any beer with an alcoholic content above 5% cannot be sold in regular convenience stores. Beers with alcohol levels above this threshold are sold by a government owned retailer called Vinmonopolet (the Wine Monopoly). All beers purchased from regular stores (about 50% of our sample) thus have little variation in alcohol content. We therefore chose to use categorical variables to measure alcohol content as this makes it easier to interpret the results. We also ran the test using alcohol as a continuous predictor and obtained similar results. [Return to main text]
[7] As noted in footnote 3, we had one architect among the testers. We have based our analysis on the assumption that our testers were not hipsters. However, it is well known that hipster density is sky high among architects. In addition this tester looks like a hipster and talks like a hipster, but confronted with the accusation of being a hipster he vehemently denied being one (denying being a hipster is very common among hipsters). Including low hipster density occupations such as mathematician and statisticians should balance this. Still, we caution readers that our data might be hipster-contaminated, and we therefore encourage caution in interpreting our results. [Return to main text]

Proceedings of the Natural Institute of Science (PNIS) by https://instsci.org/ is licensed under a Creative Commons Attribution-ShareAlike 4.0 International License.