
Tweet
January 27, 2015
Proceedings of the Natural Institute of Science | Volume 2 | HARD 1
According to this analysis, the biggest upset in Super Bowl history occurred more recently than you think
Matt J. Michel1
1 - Editor, PNIS

Introduction
Your grandfather will tell you that the biggest upset in Super Bowl history was Super Bowl III in 1969, when the New York Jets, led by Joe Namath, beat the Baltimore Colts by a score of 16 to 7. Your dad will probably tell you the same thing. So do a lot of people in this video who know a lot more about football than I do[1].
In terms of Vegas betting lines, Super Bowl III was indeed the biggest upset. The Colts entered the game as 18-point favorites, mostly because the conference that they were representing—the NFL—was seen as vastly superior to the Jets’ conference—the AFL. To date, the Colts are the most heavily favored team to lose the Super Bowl.
But is Super Bowl III really the biggest upset in Super Bowl history? Is this claim supported by data? After a quick Internet search, there doesn’t seem to be any study that tries to quantify Super Bowl upsets (apart from just scanning Vegas betting lines). Thus, the goal of this study is to make that quantification: according to the data, what is the biggest upset in Super Bowl history?
Methods & Results & Discussion
Our approach is based on rankings. The team that is better than the other team at certain important metrics (like Total Points Allowed) should be favored. While there are many different metrics or criteria that could be considered, we chose a total of 24 based on the opinions of various sportswriters and analysts (Chin and Granat 2011, Berger 2012, Silver 2013, Dewan 2014, Lindholm 2014). These metrics were:
• Defensive: First Downs Allowed, Passing First Downs Allowed, Rushing Yards Allowed, Total Yards Allowed, Yards Per Play Allowed, Passing Yards Allowed, Rushing Attempts Allowed, Rushing First Downs Allowed, Rushing Yards Per Carry Allowed, Points Against, Defensive Simple Rating System (DSRS)[2]
• Offensive: Passing Yards, Rush Attempts, Rushing Yards Per Carry, Points Scored, Interceptions Thrown, Offensive Simple Rating System (OSRS)
• Team: Regular Season Record, Point Differential, Turnover Differential, Number of Double-digit Wins, Experience in Past Super Bowls, ‘Hotter’ Team (record in last 4 games before playoffs)
• Identified as favorites by Vegas
For each of the past 48 Super Bowls, we simply determined which of the two involved teams had the higher ranking at each of the 24 criteria. Ties were omitted. All data was obtained from Pro-Football-Reference.com. (except the Vegas favorites). An MS Excel spreadsheet is available here.
Before we added up the rankings for each team, we first determined whether our metrics were actually good predictors of winning the Super Bowl. For each criterion, we determined all the instances in which the better team actually did win the Super Bowl, and then divided by the total number of Super Bowls (after omitting ties). For example, there were 8 instances in which two teams had identical regular season records entering the Super Bowl. Of the remaining 40 Super Bowls, the team with the better record won 25, giving a percentage of 62.5%. Table 1 lists the results for all 24 criteria.
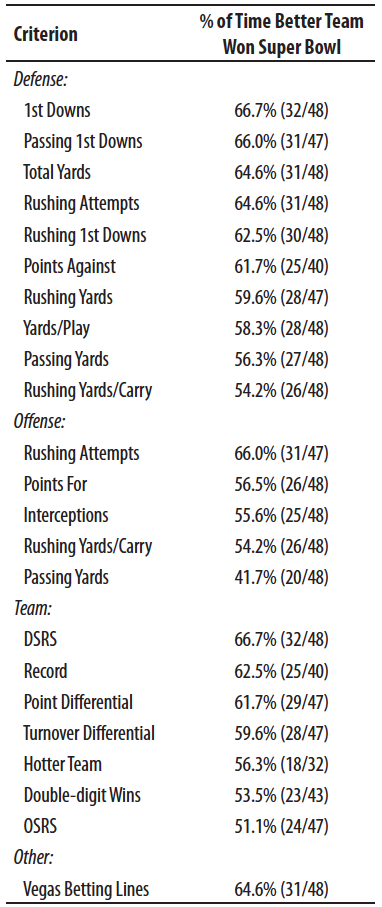
From Table 1, we see that the higher ranked team won > 50% of Super Bowls for every criterion except Total Passing Yards. The team having more Passing Yards won the Super Bowl only 41.7% of the time. Thus, in our rankings, we reversed Total Passing Yards, and determined which team in each Super Bowl had the least Passing Yards. All other criteria remained the same.
Before we get into quantifying the biggest upsets, it might be worthwhile to look at the metrics that best predicted the Super Bowl outcome (Table 1). The best predictors were First Downs Allowed and DSRS (with Rushing First Downs Allowed and Rushing Attempts a close second). In fact, 5 of the top 9 criteria are defensive (plus, the difference between DSRS and OSRS is striking), adding support to the popular dogma that “defense wins championships”.
Now that we know our proper criteria, we can define an upset as an instance in which the Super Bowl winner was ranked higher in less criteria than the loser (see Figure 1). In Figure 1, the winning team is bolded and in a larger font, and upsets are shown as thicker vertical lines with the length of the line measuring the size of the upset.
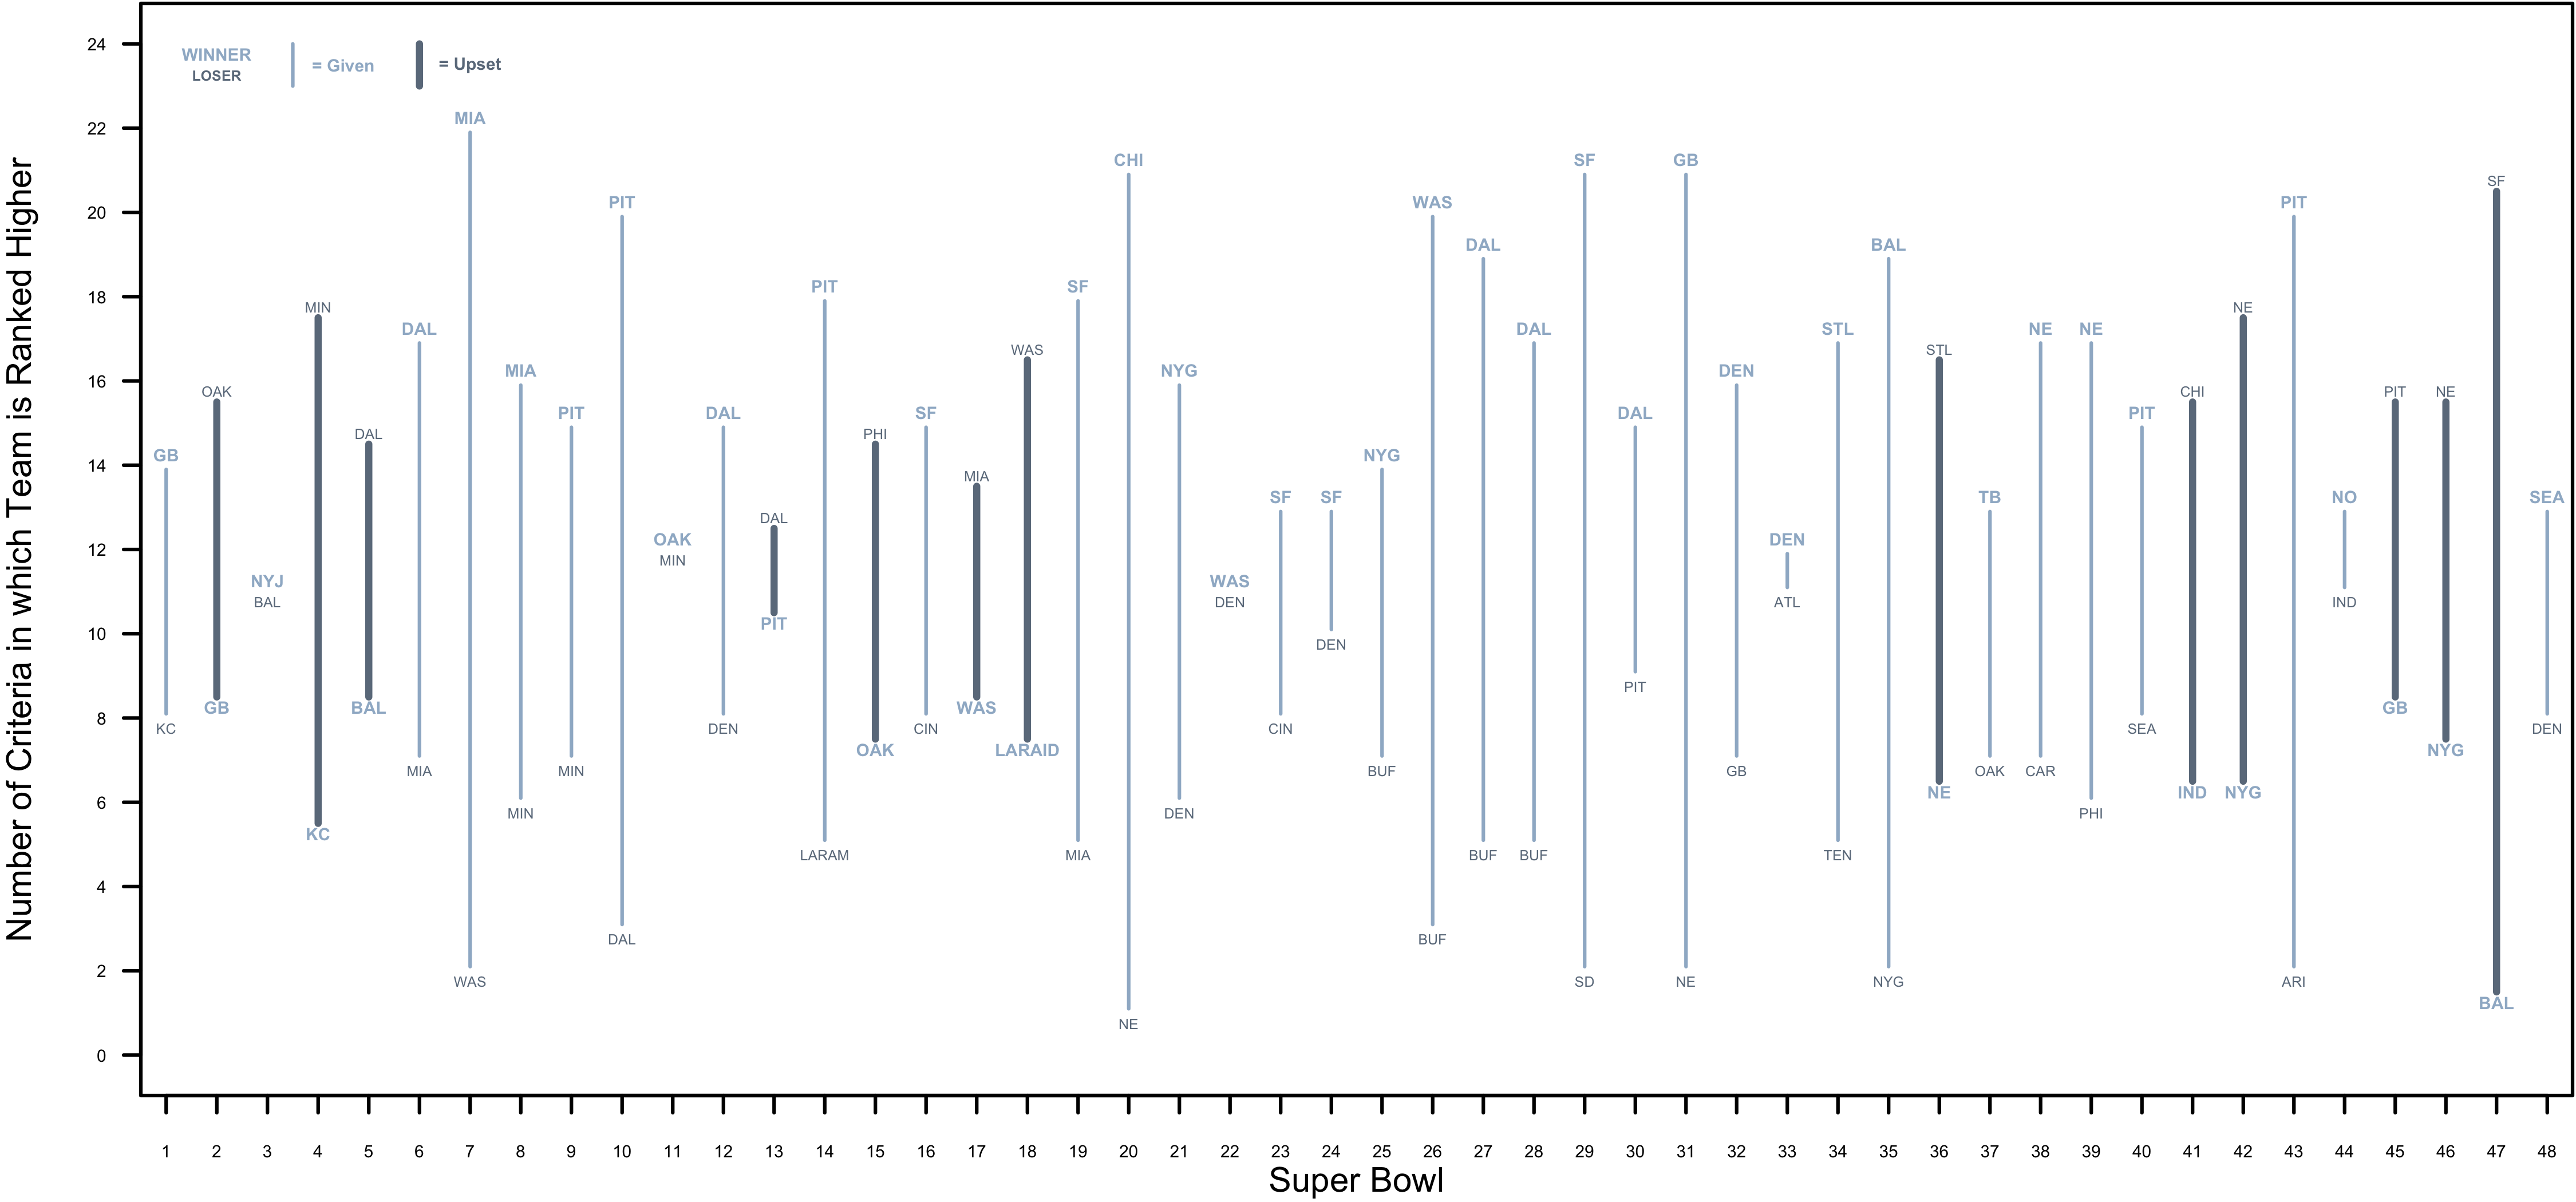
Using our approach, there have been 13 Super Bowl Upsets and 3 evenly matched Super Bowls (i.e., both teams ranked higher in the same number of criteria). Of the 13 upsets, the largest, by far, appears to be Super Bowl 47[3], two years ago in 2013. The Baltimore Ravens were ranked higher in just one of our criterion (Total Points Scored[4]), yet defeated the San Francisco 49ers 34 to 31[5]. The other top upsets were: Super Bowl 4 (Kansas City chiefs defeated the Minnesota Vikings, despite being better in only 5 criteria), Super Bowl 42 (New York Giants over the New England Patriots; Giants better in 6 criteria), Super Bowl 36 (New England Patriots over St. Louis Rams; Patriots better in 6 criteria), and Super Bowl 18 (Los Angeles Raiders over Washington Redskins; Raiders better in 7 criteria). Three of these upsets (Super Bowls 4, 36 and 42) are also regarded by football experts as the biggest Super Bowl Upsets of all time (Chang 2012), lending some legitimacy to our methods.
As Table 1 shows, though, not all criteria are equally predictive. For example, it would be better for a team to be ranked higher in DSRS rather than OSRS. Thus, we weighted each criteria based on the percentages in Table 1. For example, the team ranked higher in DSRS got 0.667 points while the team ranked lower in DSRS got 0.333 points (ties resulted in 0.5 for both teams). Then, we just added up each team’s weighted points and calculated a difference between the Super Bowl Winner’s Total Points and the Super Bowl Loser’s Total Points (so a negative number would indicate an Upset). Figure 2 shows the results.

Again, Super Bowl 47 emerges as the biggest Upset. There are also some upset Upsets that appear. Super Bowl 41, when the Indianapolis Colts defeated the Chicago Bears, turned out to be quite the upset (after all, Chicago was the better team in 16 out of 22 criteria. Unfortunately, their quarterback was Rex Grossman).
We can also determine which Super Bowl was the biggest “no-brainer” or, in other words, the Super Bowl in which the eventual winner was clearly the better team (for lack of a better word, we refer to these as “givens”). The biggest Given was Super Bowl 20, when the Chicago Bears and Coach Mike Ditka defeated the New England Patriots. The Bears won the game by 36 points, so Super Bowl 20 is likely the most lopsided matchup of all time. Other top Givens were Super Bowl 31 (Packers over Patriots), Super Bowl 43 (Steelers over Cardinals), Super Bowl 43 (Redskins over Bills), and Super Bowl 29 (49ers over Chargers). The average margin of victory for these 5 Super Bowls is 18 points.
Lastly, we can determine which Super Bowl featured the two most closely matched teams, by finding the matchup whose weighted difference was closest to zero. That occurred in Super Bowl 13 when the Pittsburgh Steelers defeated the Dallas Cowboys 35 to 31. Las Vegas bookies remember this game as “Black Sunday” in which the Cowboy’s late surge covered the 4-point spread.
So, what about Super Bowl 3, the purported biggest Upset in Super Bowl history? Well, it turns out to be much closer than people realize. The New York Jets were ranked higher in 11 criteria, the Baltimore Colts were ranked higher in 11 other criteria, and they were tied in 2 criteria. Going by the weighted difference, it appears that the game wasn’t an upset at all; the Jets held a slim 0.53-point advantage.
Super Bowl 3 undoubtedly changed the history of the NFL by signaling that the perceived mediocre AFL was indeed on par with the rest of the league. But it wasn’t the biggest upset in Super Bowl history and you should stop telling that to your kids and grandkids. Instead, you can regale them with the tale of how Joe Flacco led his team to a most improbable victory. It’s probably not a better story, but at least it’s correct.
Footnotes
[1] It was also voted as the Best Answer in this Yahoo! Answers thread, which is one step below a Scientific Fact [Return to main text]
[2] This, along with Offensive Simple Rating System (OSRS), is explained here [Return to main text]
[3] Because no one understands Roman numerals, Super Bowls will be referred to by their Arabic numerals (e.g., 1, 2, 3, etc.) from here on out. [Return to main text]
[4] And it was only by one point. Baltimore scored 398 regular season points while San Francisco scored 397. [Return to main text]
[5] You may remember this game as the “Harbowl” or “the one with the power outage”. [Return to main text]

Proceedings of the Natural Institute of Science (PNIS) by https://instsci.org/ is licensed under a Creative Commons Attribution-ShareAlike 4.0 International License.