Tweet
July 30, 2015
Proceedings of the Natural Institute of Science | Volume 2 | HARD 10
The Best and the sneakiest: Minimizing the cost associated with false publication histories
A. S.1 and C. C.1
1 - [email protected]

Introduction
A recent report in the journal Medical Education found that approximately one in four applicants to medical residency programs in Canada had “misrepresented” their scientific publication history. This brings about an important question for educators and admissions officers: given a set of applications in which a certain percentage will incorrectly report their publication history, what is the most efficient method to verify the application’s veracity? In other words, how many applications, chosen at random, should be checked in depth in order to improve detection of fallacious publications. This article presents an analytic approach to determining this value.
Methods
Approaching this question from a naive standpoint, the number of applications that can be checked is a function of cost; if it were free to check, all applications would be verified. However, in all cases, checking details of applications involves a cost. How many applications should be selected for random screening? There are 3 main costs to minimize in this problem: the absolute cost, the cost of false negatives, and the cost of waste. In other words, these values are the cost to check an application, the cost of accepting a lying application and the cost associated with checking applications and not finding anything, respectively.
The first cost – the absolute cost – is simply the cost of checking an application, therefore it would be proportional (∝) to the number of applications checked (napplications):
The second cost – the false negative probability (F. N. P.) – will be proportional to the number of applications not checked, and the percent of people that lie (i.e. what percentage of applications that weren’t checked are lying:
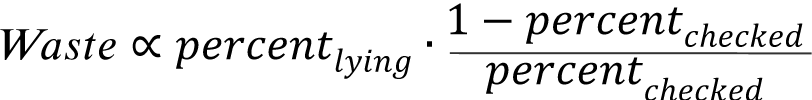
Lastly there’s the cost of waste, the so called “bang for your buck”, analogous to a measure of efficiency. This cost is proportional to the percentage missed, and inversely proportional to the percentage caught:
Note that since these cost functions are on different scales (cost is up to this point a concept and not a monetary value), and as such they should be mapped to the range [0,1] to facilitate comparison. This process forces the maximum cost to be equal to 1 and the minimum cost to be 0. The observant reader would notice that in normalizing each function to [0,1], this would effectively eliminate the contribution of the percentlying; this issue will be addressed in a subsequent analysis.
The importance of these cost functions varies depending on the situation. For example the cost of a false negative in scholarship applications might be much higher than in job applications as a scholarship is simply a gratuity of funds, whereas the job will train the applicant regardless of experience. Therefore, in order to weight importance, each function is scaled by a constant (C1, C2, C3), representing the relative cost. As an example: C1 = 100, C2 = 50 and C3 = 25, meaning that the cost of C1 is worth 4 times that of C3 and twice that of C2.
Results
For the purposes of our analysis, we set C1 = 100, C2 = 50 + percentlying and C3 = 25 + percentlying. Logically, this means that at a rate of lying of 50%, false negatives are equally important as the sheer cost of checking the application. Here it is also assumed that percentlying = 25%, equal to what has been reported previously (see Introduction).
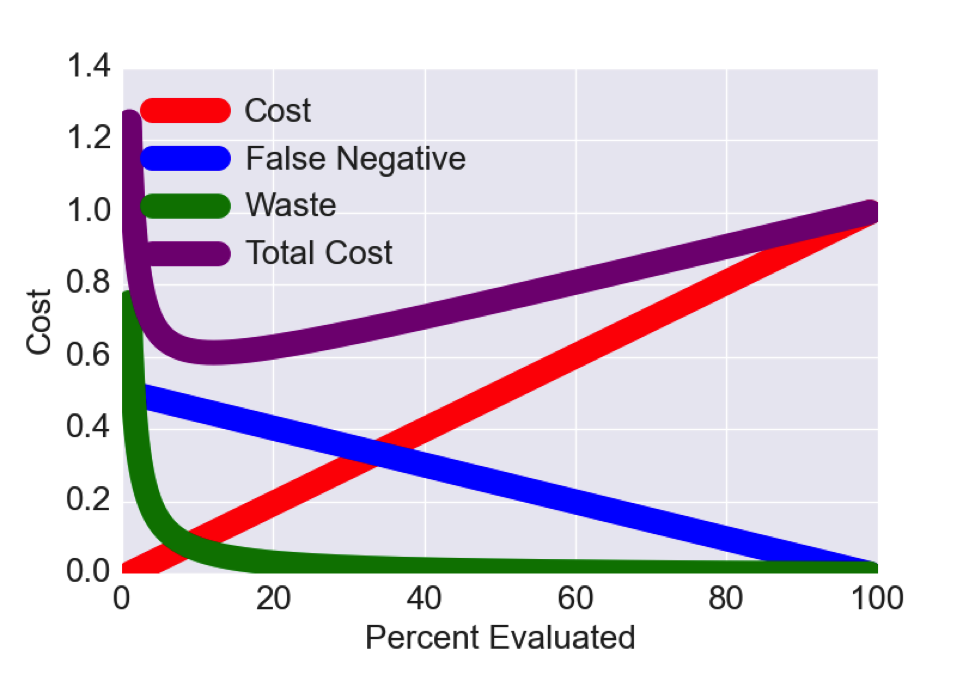
As observed in Figure 1 total cost has a minima ~12% (12.2%), the interpretation being that an institution following the rules as defined by the constants (C1, C2, C3) would expect to minimize their cost by evaluating 12% of their applications fully.
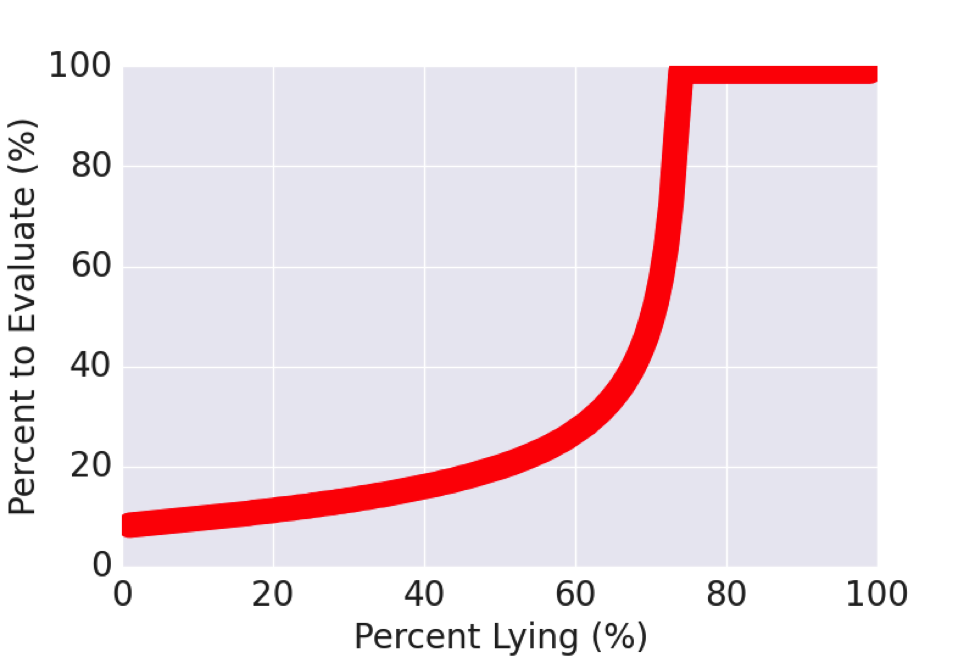
There is another aspect to this problem that has yet to be discussed. In the previous example, the rate of lying was assumed to be 25%, what happens when that rate varies?
In Figure 2, it is observed that while the rate of lying is relatively low (< 50%), only ~20% of applications need to be evaluated, however at that point, the number of applications required rises sharply and a lying rate of 20% higher means that all applications need to be evaluated. This is because at such a high lying rate, the false negative costs dwarf the absolute cost.
Discussion/Conclusion
In this preliminary examination of misrepresented publication history, we show that depending on several factors, it would be worthwhile for institutions to invest time into application verification. This report served to determine the number of applications to evaluate, however in reality no absolute conclusion can be made seeing as the importance constants for each factor vary by application and institution. Globally one can infer that if the rate of lying is relatively low, a small percentage need to be checked. However, once the rate of lying increases past that point, it grows at a rate such that it’s worth looking at every application. The authors leave the interpretation of this fact to the reader, as some institutions are more trusting of their applicants than others, and the authors would not wish to impose their personal biases on the reader. The issue of false reporting in science and medicine is one that must be addressed if we are to train more talented doctors and researchers.

Proceedings of the Natural Institute of Science (PNIS) by https://instsci.org/ is licensed under a Creative Commons Attribution-ShareAlike 4.0 International License.