
Tweet
May 14, 2015
Proceedings of the Natural Institute of Science | Volume 2 | HARD 7
Dispatch from the Obvious Department: The New Yorker cartoons drawn by females contain more female characters
PNIS Editorial Staff1
1 - PNIS

Introduction
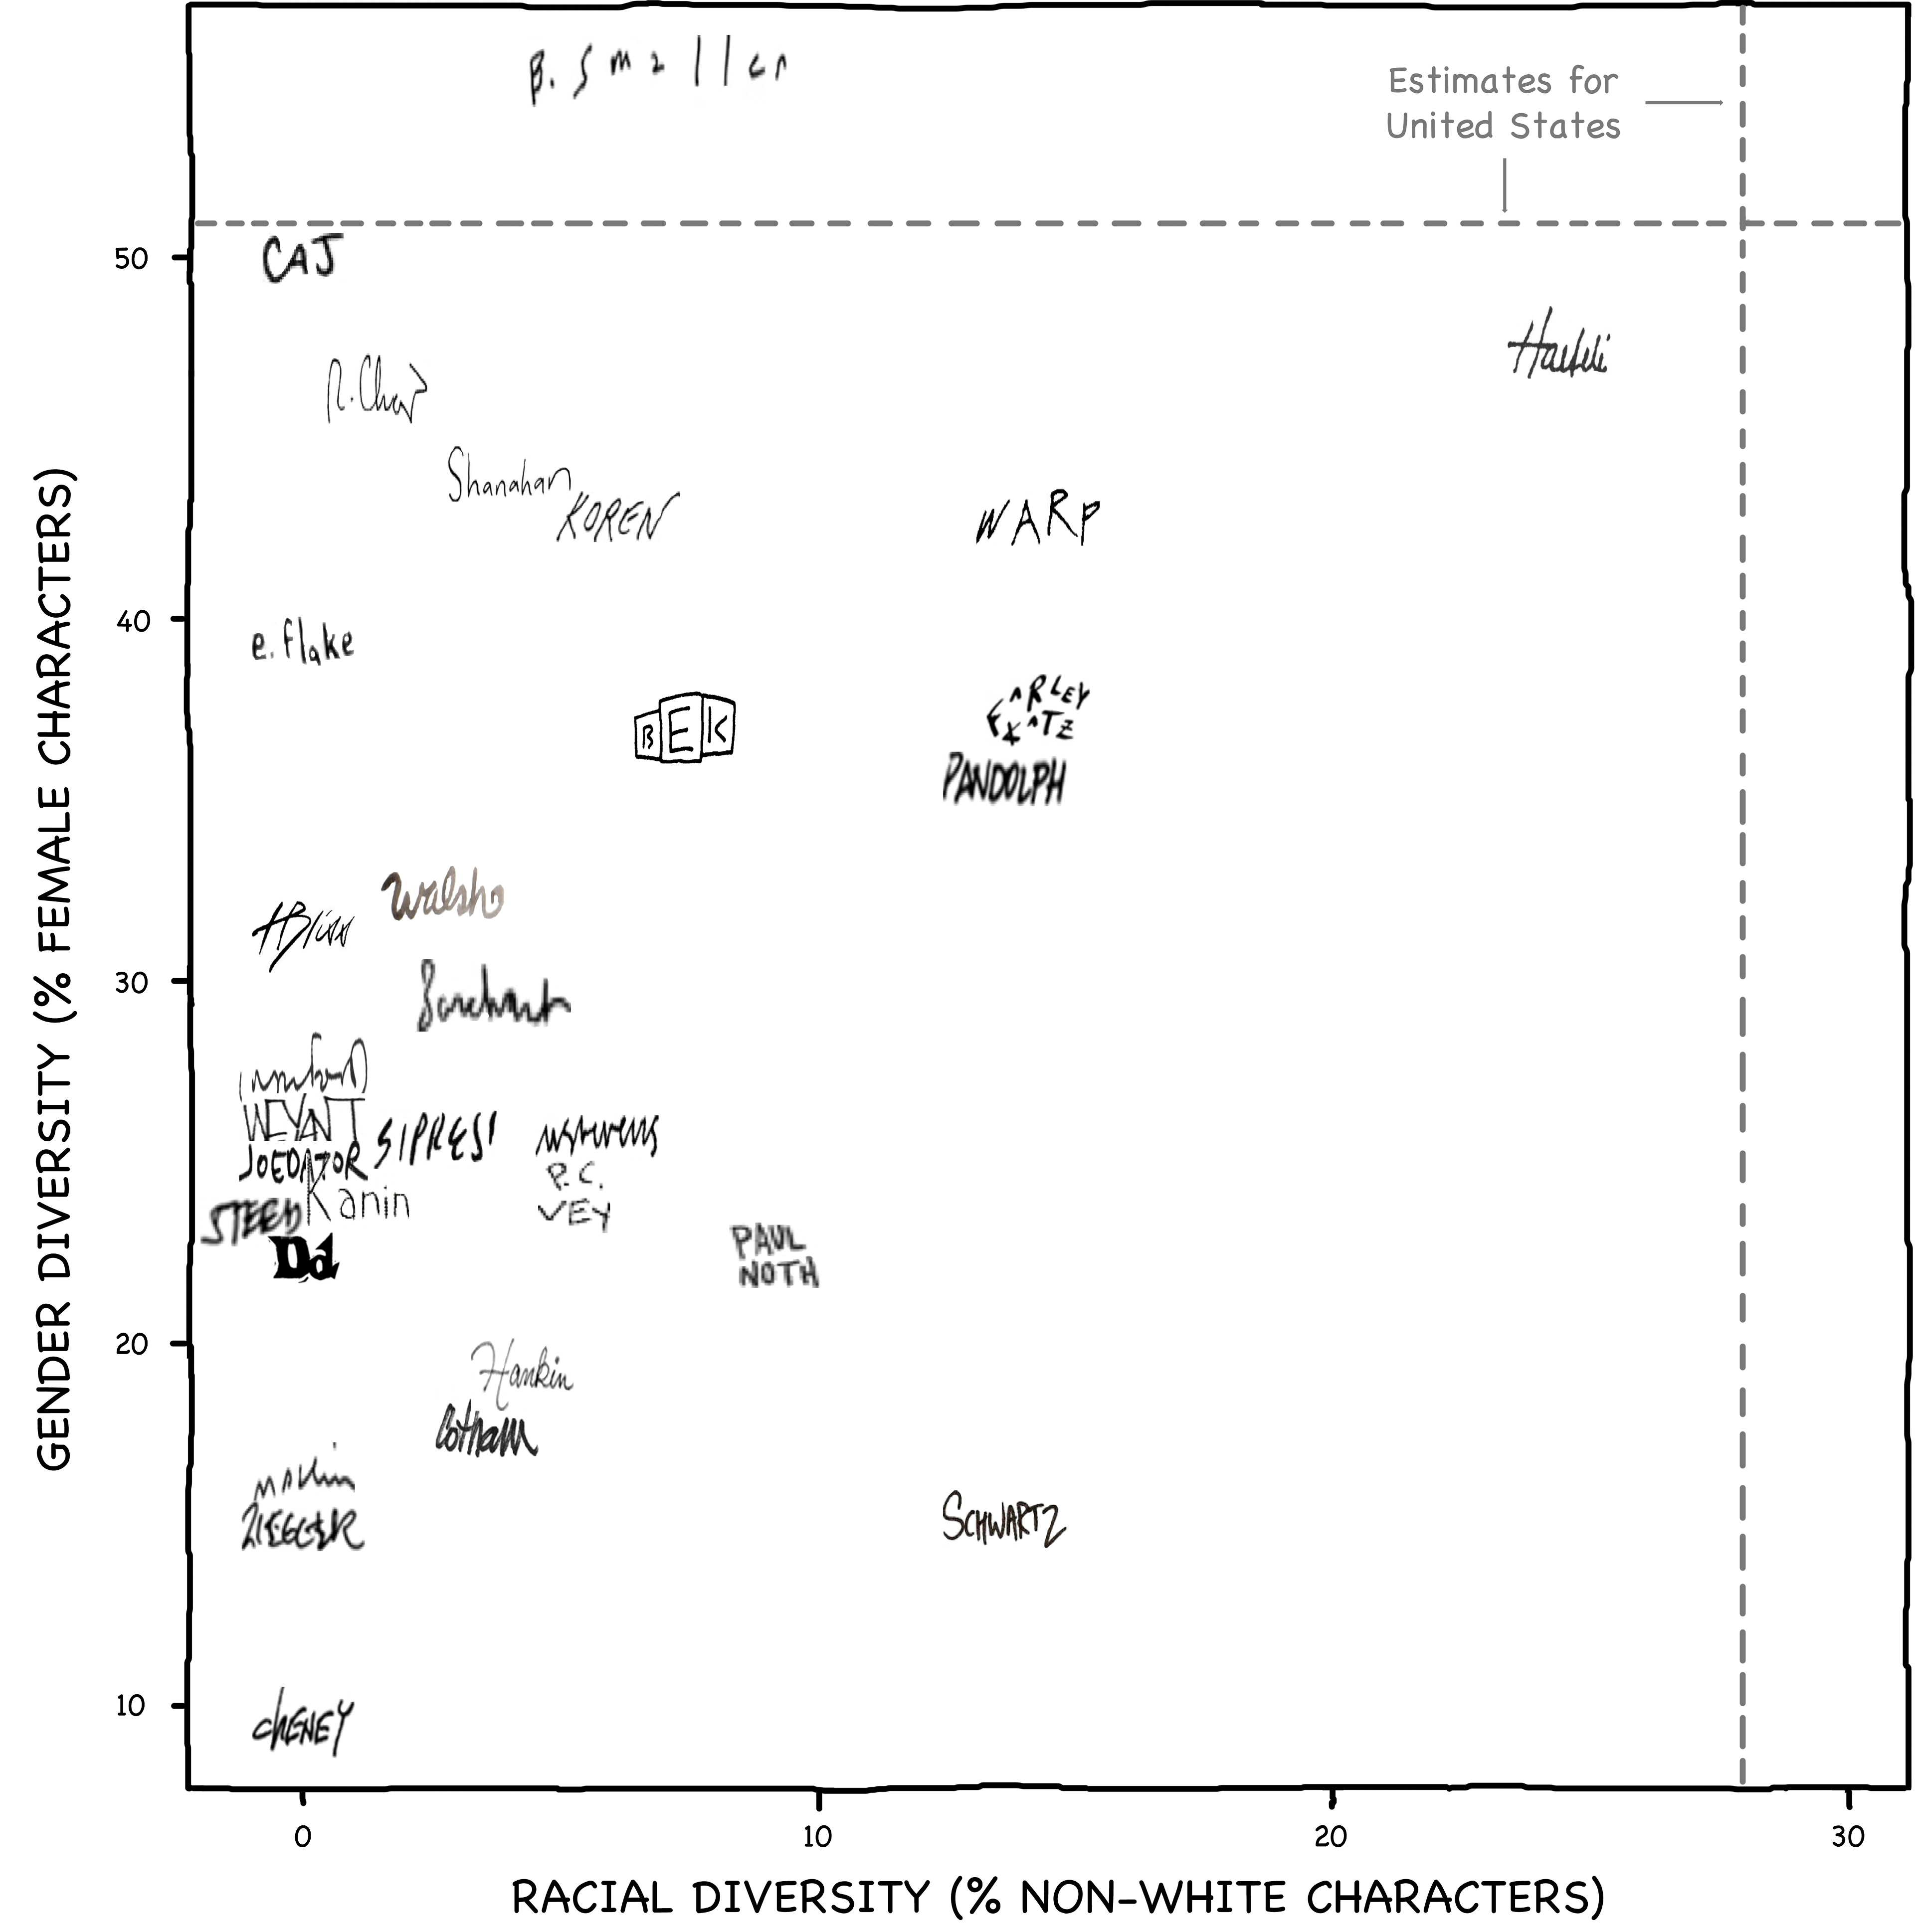
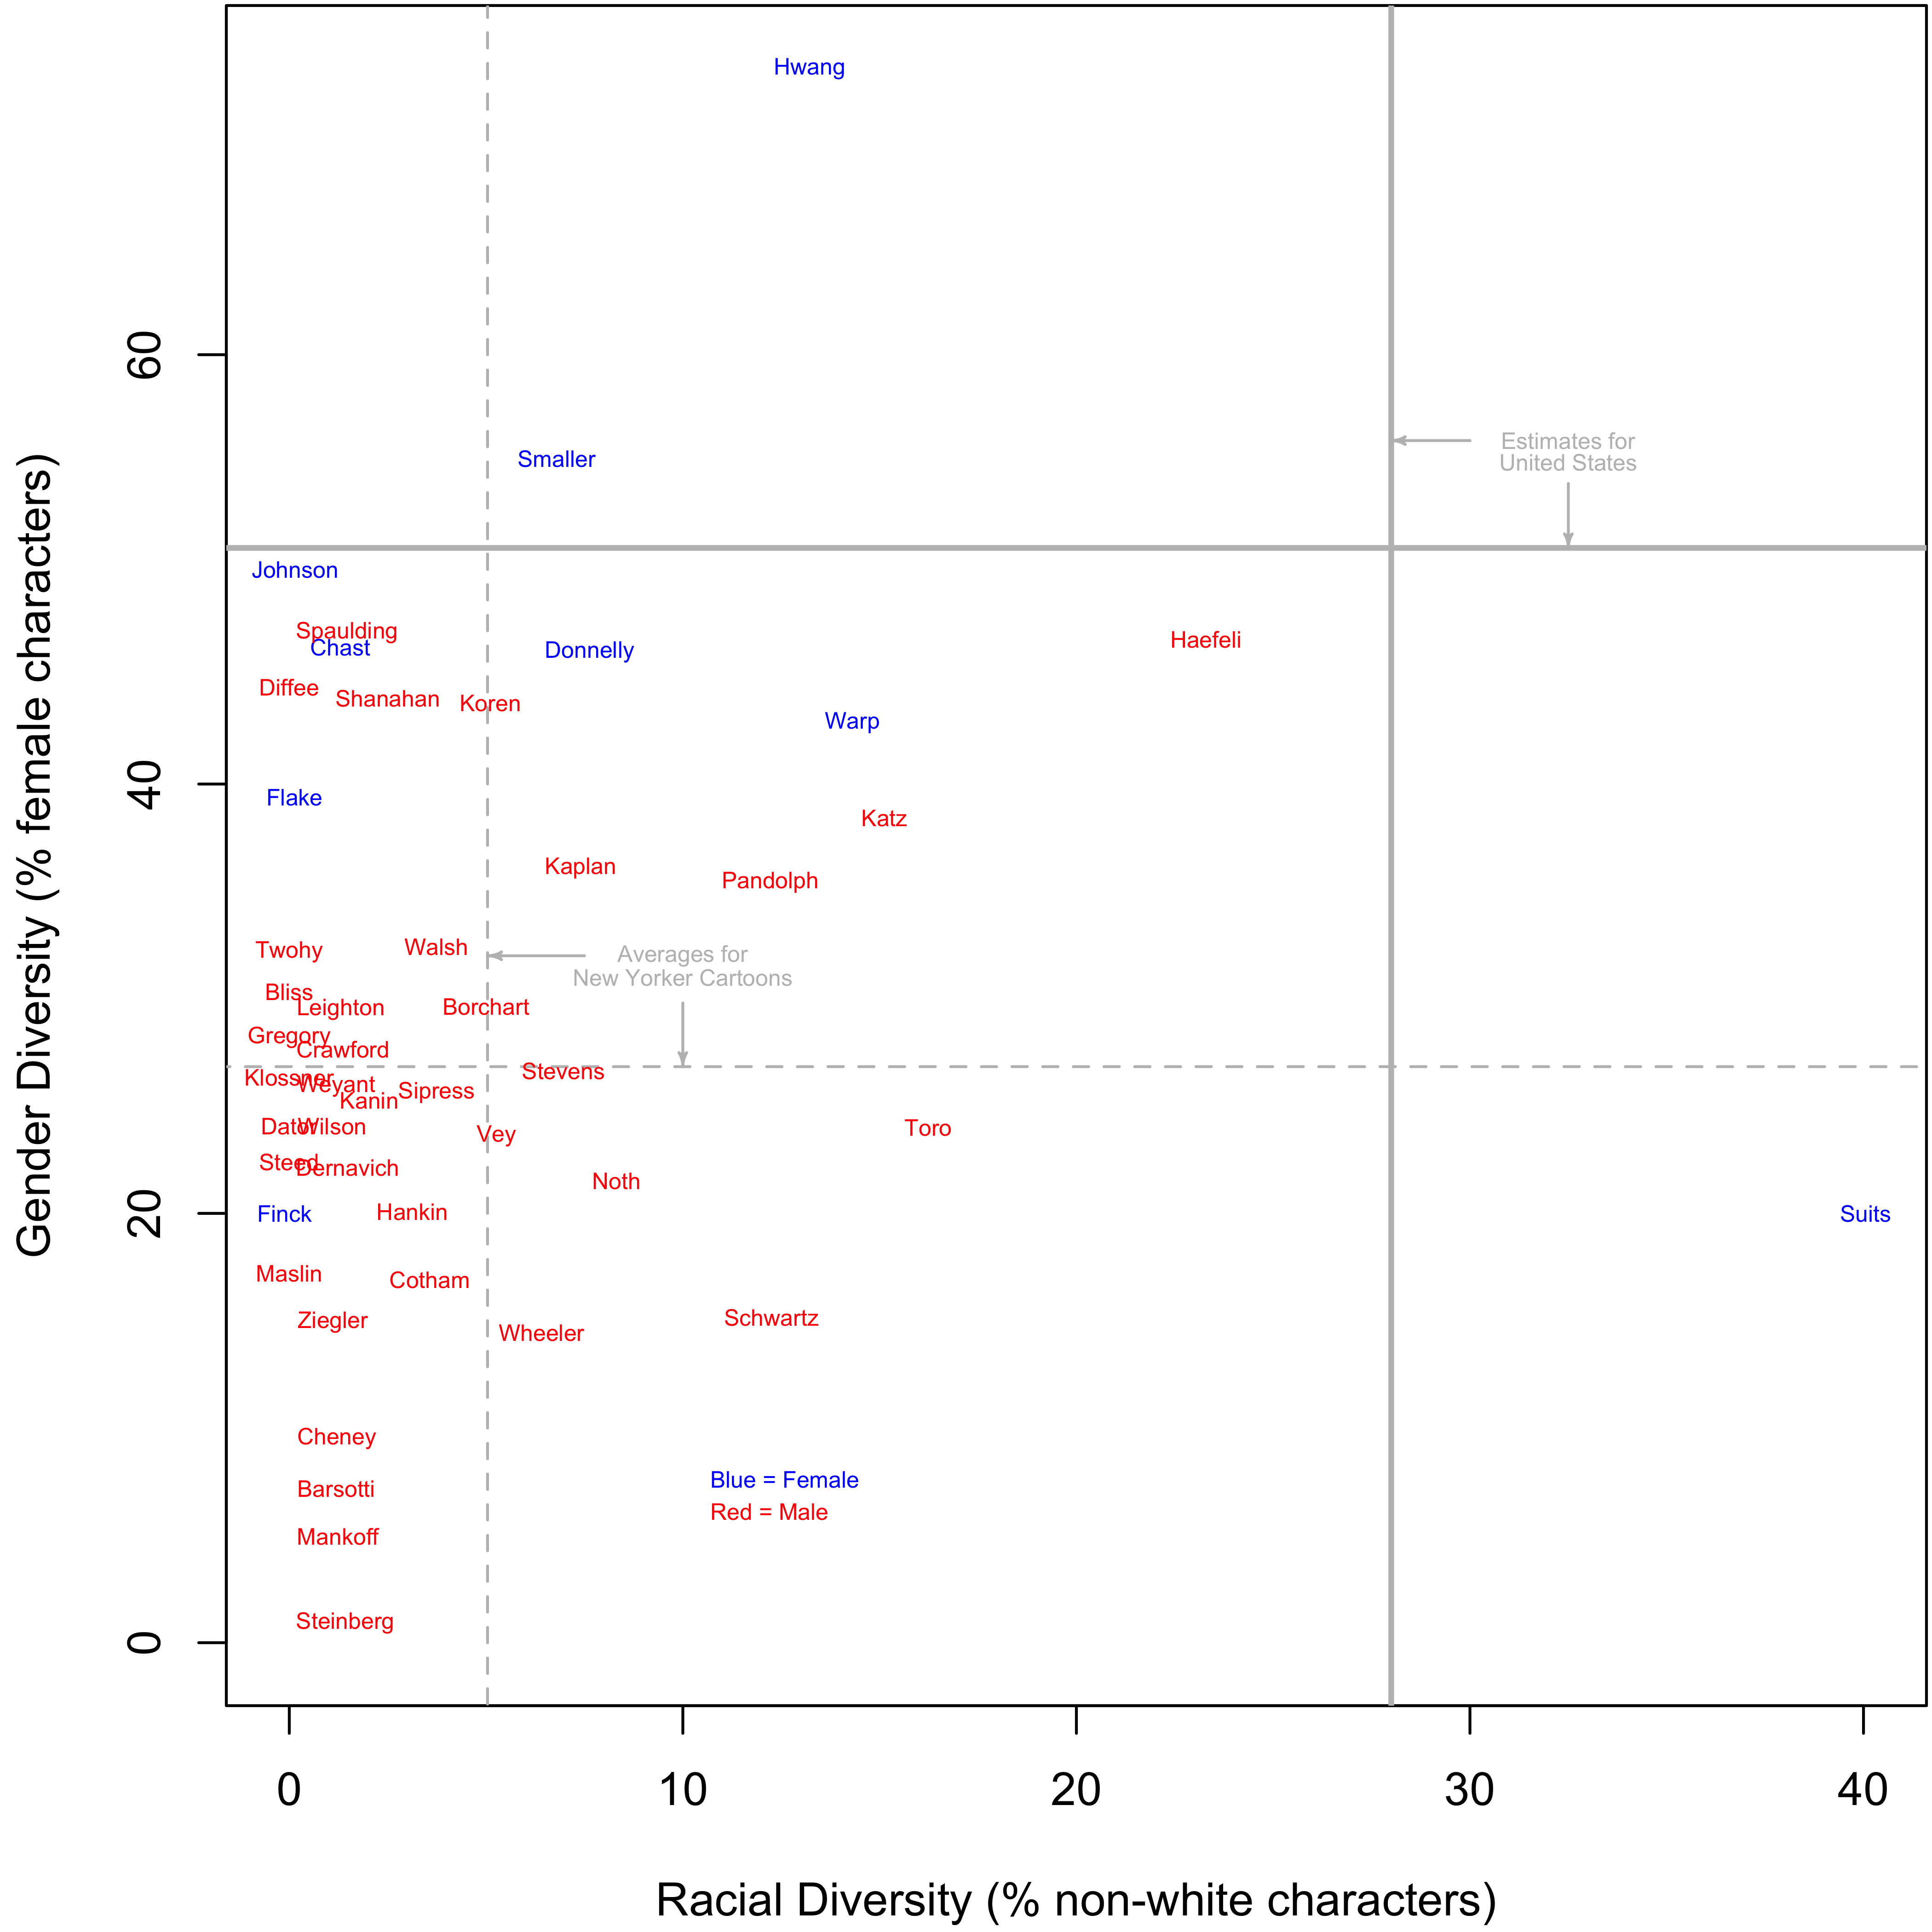
Last week, we took a look at the gender and racial diversity of characters drawn in the cartoons of The New Yorker. The major finding was that female and minority (i.e., non-white) characters are depicted at a rate far below their representation in the American population (females depicted at about 21.6 percentage points below the U.S. estimate, non-whites depicted at about 22.7 percentage points below). We also made a fun figure (Fig. 2) and a more informative, less-fun figure (Fig. 3) depicting how often each cartoonist depicted females and non-whites.
In Figure 3, we noticed a pattern that female cartoonists (those depicted in blue) seem to draw female characters, but probably not non-white characters, at a higher rate than male cartoonists (depicted in red). This led to our question today: can we find characteristics of cartoonists that predict the % female or % non-white characters drawn by them?
This wouldn’t be the first time a hypothesis like this has been tested. For example, Glascock and Preston-Schreck (2004) suggested that the lack of racial diversity of cartoonists was partly responsible for a 4% representation of minority characters in newspaper comics, a sentiment echoed by Tyree (2013) looking exclusively at the representation of black female characters in comic strips.
So gender and ethnicity of the cartoonist could be factors determining how often they draw diverse characters. We also thought age of the cartoonist might be a factor, since younger people tend to have a more favorable attitude towards racial diversity. There are probably other important factors to consider (e.g., where the cartoonist was raised, level of education, etc.), but there’s really limited biographical information on a lot of these cartoonists. Thus, we settled on examining how ethnicity, gender, and age of a cartoonist affect how often they depict females and non-whites.
Methods
Data collection – The only data we needed was ethnicity, gender, and age of all the cartoonists that published cartoons in The New Yorker in 2014. We got most of this data from Wikipedia, Michael Maslin’s awesome website, and the cartoonists own personal web sites. When we couldn’t determine age from online resources (this happened for about 25% of the cartoonists), we estimated age by looking at photographs. There might be some error there. We only gathered data for any cartoonist that drew more than 10 people characters in 2014 (so all the cartoonists represented in Figure 3).
It turns out that it’s really hard to get information on a cartoonist’s ethnicity on the Internet and we could only verify only a handful of cartoonist’s ethnicities. Because of the large amount of missing data, we didn’t include ethnicity in any of our statistical analyses. That left us with just two characteristics with which to explain % female and % minority characters drawn: gender and age.
Another point worth mentioning regarding this data is that what gets published in The New Yorker is a reflection of both the cartoonist and the cartoon editor, Robert Mankoff. Cartoonists submit hundreds of cartoons to Mankoff every week from which he can only choose about 16 or 17 for each issue. Thus, the diversity we see in The New Yorker is sort of an equation of “How selective Mankoff is towards diverse cartoons” + “How much diversity cartoonists actually draw”. So when we say something like “females draw more female characters”, we really mean “females draw more female characters in cartoons that end up getting published in The New Yorker.” We use the brief version for both our benefit, and hope it doesn’t lead to any confusion.
Statistical analyses – Figure 3 shows variation in both % female and % non-white characters drawn by the different cartoonists. We can use a statistical model to find out how much of this variation can be explained by the age of the cartoonist or the gender of the cartoonist. To make things simpler, we analyze % female with its own statistical model, and % non-white with its own model. This footnote will describe more our statistical methods in greater detail[1].
Results
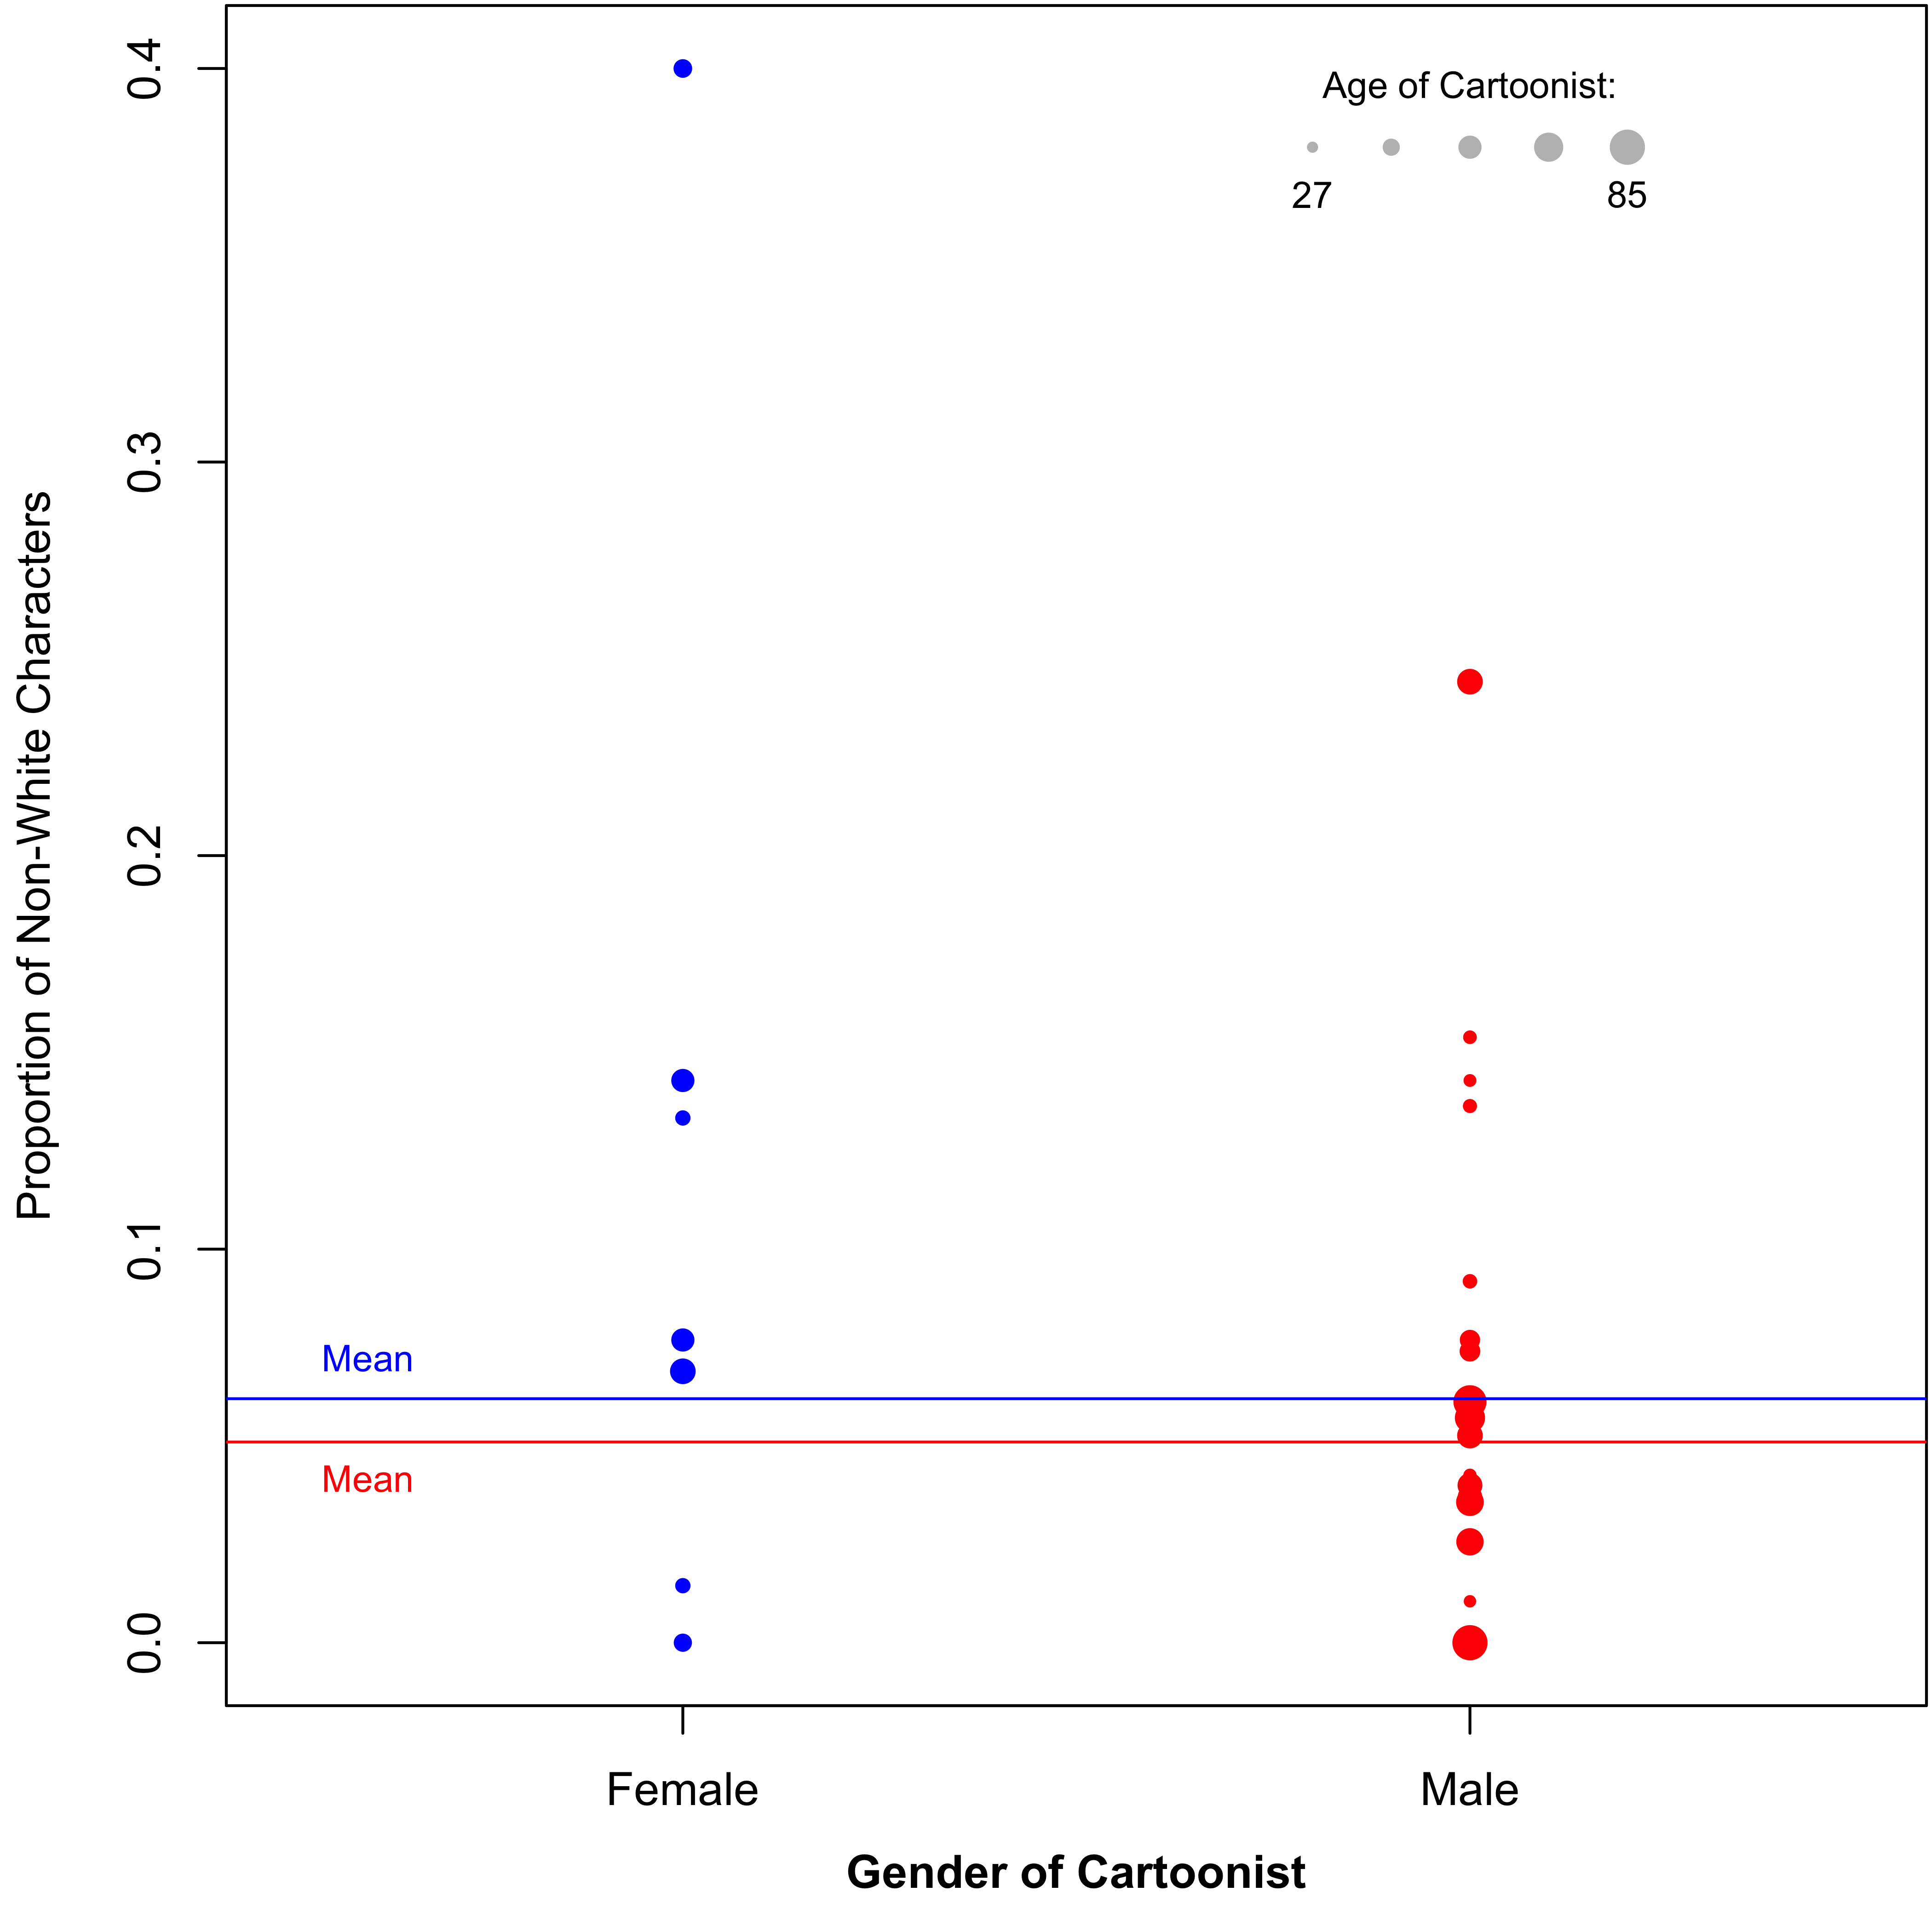
Proportion Non-White – Neither gender nor age explained a great deal of the variation in the % of non-white characters: Age explained 0.0025% and Gender explained 0.304%, leaving a whopping 99.695% unexplained. Overall, female cartoonists drew 6.2% of their characters as non-white, while male cartoonists drew 5.1% as non-white (Fig. 1).
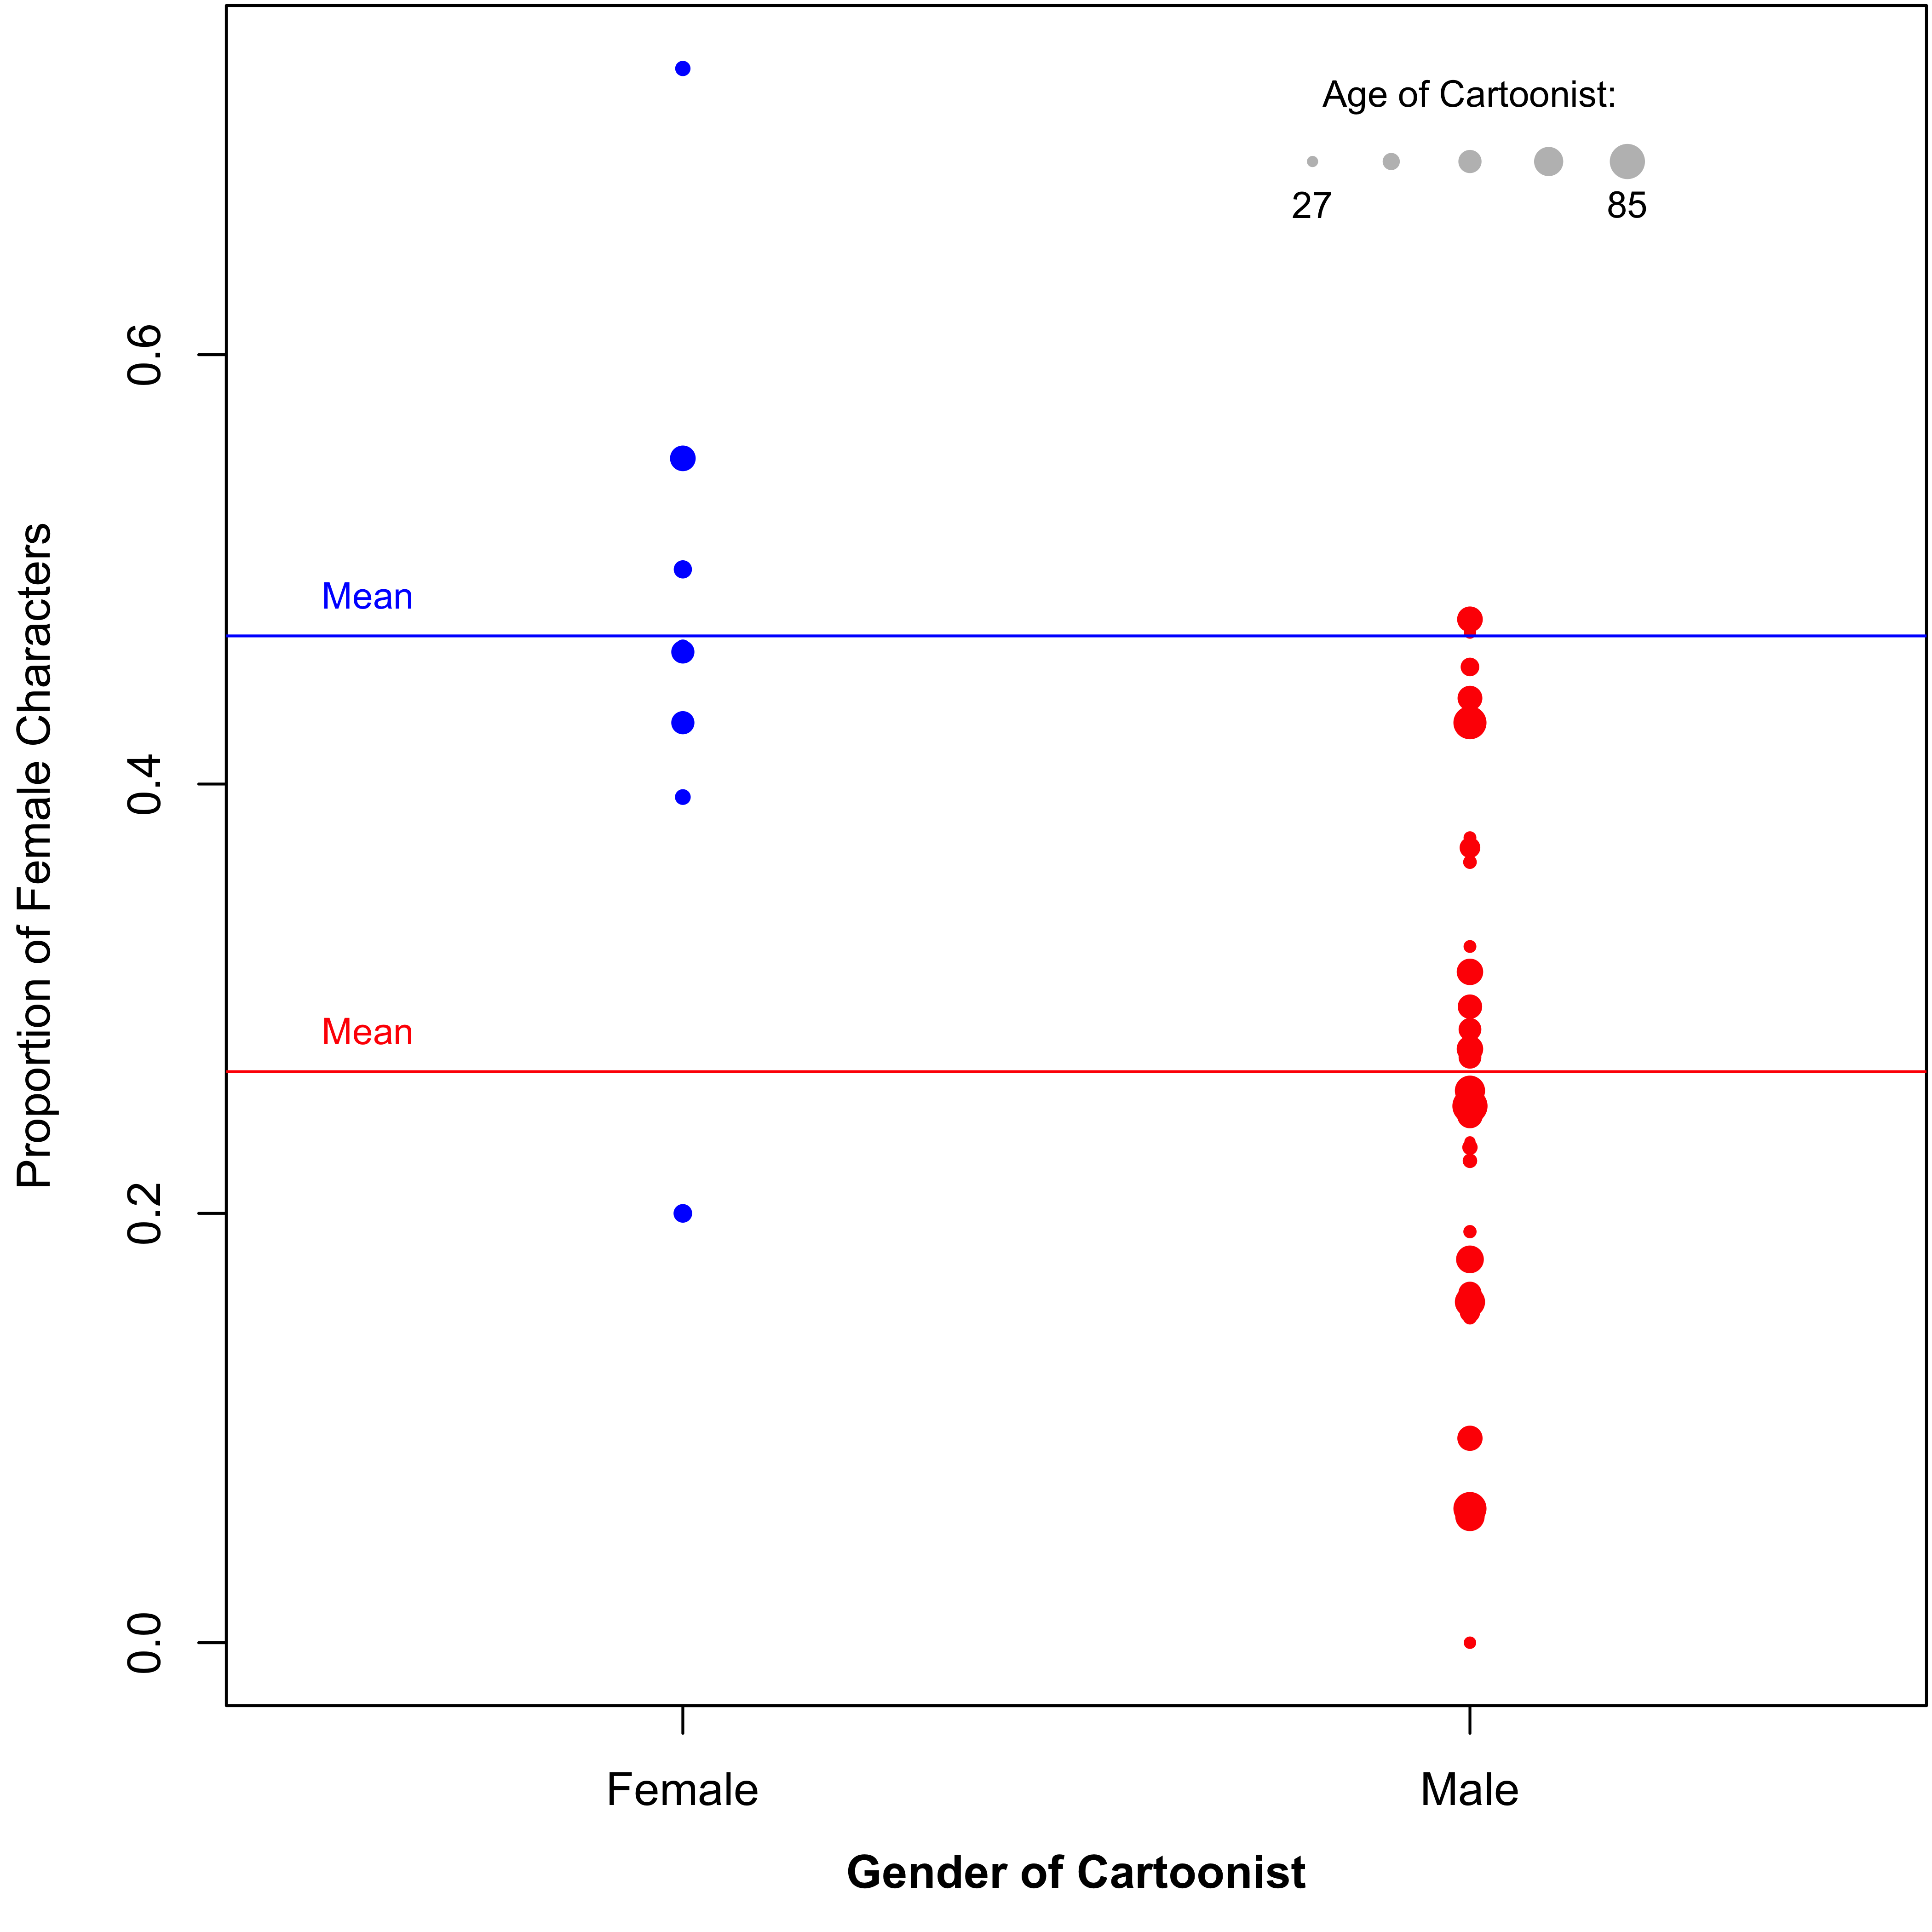
Proportion Female – Some more variation was explained here. While Age only explained about 0.15% of the variation, Gender explained nearly 31%, a significant amount[2]. Female cartoonists portrayed 46.9% of their characters as female, almost twice as much as male cartoonists who drew 26.6% as female (Fig. 2).
Discussion
Unsurprisingly, female cartoonists drew a significantly higher proportion of their characters as female. This is the “behind the scenes” effect noted by Glascock and Preston-Schreck (2004), that the gender/racial diversity of the characters in newspaper comics will closely match that of its creators. As only 12 of the 70 cartoonists who published cartoons in The New Yorker in 2014 were female, this explains in part the low representation of female characters. Researchers (such as Tyree 2013) have suggested the hiring or inclusion of more minority cartoonists as a potential remedy to this problem, and we shall see if The New Yorker follows suit.
However, this doesn’t explain everything, as both % non-white and % female still had a lot of variance that was not explained by either Age or Gender. What might explain that which we couldn’t explain? Robert Mankoff, the current cartoon editor of The New Yorker, has said that their cartoons requires the viewer to undergo the process of bisociation, a term coined by Arthur Koestler which describes the mental process of associating two or more normally unrelated ideas. Mankoff says that viewers need to successfully complete these mental acrobatics in under 0.5 seconds to understand a cartoon. To this end, stereotypes can be very helpful, and the cartoonists use them quite frequently. Mobsters are always portrayed as white males. Taxi drivers and prisoners are always males. Acrobats, receptionists, fairies, and models are all white females. Stereotyping becomes a mechanism through which cartoonists can help the viewer bisociate the cartoon. A female basketball player, while common in reality, might temporarily cog a viewer’s brain (“why is the basketball player a woman?”, “is that supposed to be Lisa Leslie?”, “is a female basketball player the punchline here?”, etc.) and delay or prevent a cartoon’s humor.
Note that this is just an explanation and not a justification of the underrepresentation of females and non-whites in cartoons. While the pursuit of maximum bisociation is understandable, we feel that cartoons that bend stereotypes would still retain their humor, especially for the highly-educated, liberal-leaning readership of The New Yorker. If we can understand the scenario of M.C. Escher being a construction worker, then surely we would be able to accept the occasional female taxi driver.
Footnotes
[1] We have proportion data (e.g., number of female characters drawn:number of male characters drawn) as our dependent variable and categorical data (gender of cartoonist) and continuous data (age of cartoonist) as our independent variables, so we used a general linear model modeled with binomial errors. We first fit a full model (with interactions). If we had overdispersion (spoiler: we did), we tried to log-transform “age”. If we still had overdispersion (spoiler: still did), we went quasibinomial. Then, we removed the significant interaction term if it wasn’t significant (spoiler: not significant for either proportion female or proportion non-white). Our final model in both cases consisted of Age + Gender (+ errors following a quasibinomial distribution). We used Deviance to estimate the percent variation explained by each independent variable. [Return to main text]
[2] Literally. Gender was a significant parameter in our final model (t = 4.56, P < 0.001) [Return to main text]

Proceedings of the Natural Institute of Science (PNIS) by https://instsci.org/ is licensed under a Creative Commons Attribution-ShareAlike 4.0 International License.