
Tweet
May 21, 2015
Proceedings of the Natural Institute of Science | Volume 2 | HARD 8
The different characters of the cartoons of The New Yorker and the cartoonists who draw them
PNIS Editorial Staff1
1 - PNIS

The last two weeks, we’ve been analyzing all the cartoons published by The New Yorker in 2014. We’ve talked about how females and non-whites are underrepresented, and how gender and age could explain how often cartoonists draw females and non-whites. We’re wrapping up by taking a look at how cartoon characters are portrayed (that is, what is their occupation or relation to the other characters in the cartoon?).
We classified each character into one of 50 different categories that best represented their role in the cartoon (all 50 are listed in Figure 1). Most of these classifications are self-explanatory (e.g., judge, lawyer, angel, office worker, etc.). For those that require further explanation:
• Assistant – mostly political aides and secretaries
• Athlete (other) – any athlete that wasn’t a golfer or baseball player
• Blue collar worker – construction workers, lumberjacks, farmers
• Boss – like the boss of an office environment
• Castaway – like the Tom Hanks movie
• Crowd – includes people in the background like tourists, fans, and bystanders
• Customer service – any occupation that involves customer service like florists, bellboys, doormen, grocery store workers, etc.
• Defendant – in a courtroom setting
• Entertainer – singers, musicians, artists, clowns, etc. Also includes famous celebrities like Bill Murray and Rembrandt.
• Fantasy figure – elves, fairies, witches, and the wise men that are seen at the tops of mountains
• Food preparer – chefs, baristas, pizza delivery persons, etc.
• Food servers – waiters, waitresses, etc.
• Historical stereotype – pilgrims, pirates, Native Americans, Hatfields & McCoys, etc.
• Literary figure – famous fictional characters like Captain Ahab
• Medical – includes nurses, doctors, dentists, paramedics
• Medieval/Royal Court – knights, kings, queens, jesters, etc.
• Party goer – anybody at a party
• Person – our “non-descript” category. Basically, anybody that didn’t fit any of these categories (like a heavy smoker, or an airline passenger). Most often, they were just regular people purposely drawn without characterization.
• Religious figure – St. Peter, Noah, Moses, Jesus, etc.
• Wedding party – bride, groom, best man, maid of honor, etc.
Then, we figured out how many characters fell into these classifications, as well as their ethnicity and gender. The results are plotted in Figure 1 (careful, there’s two sets of x-axes).
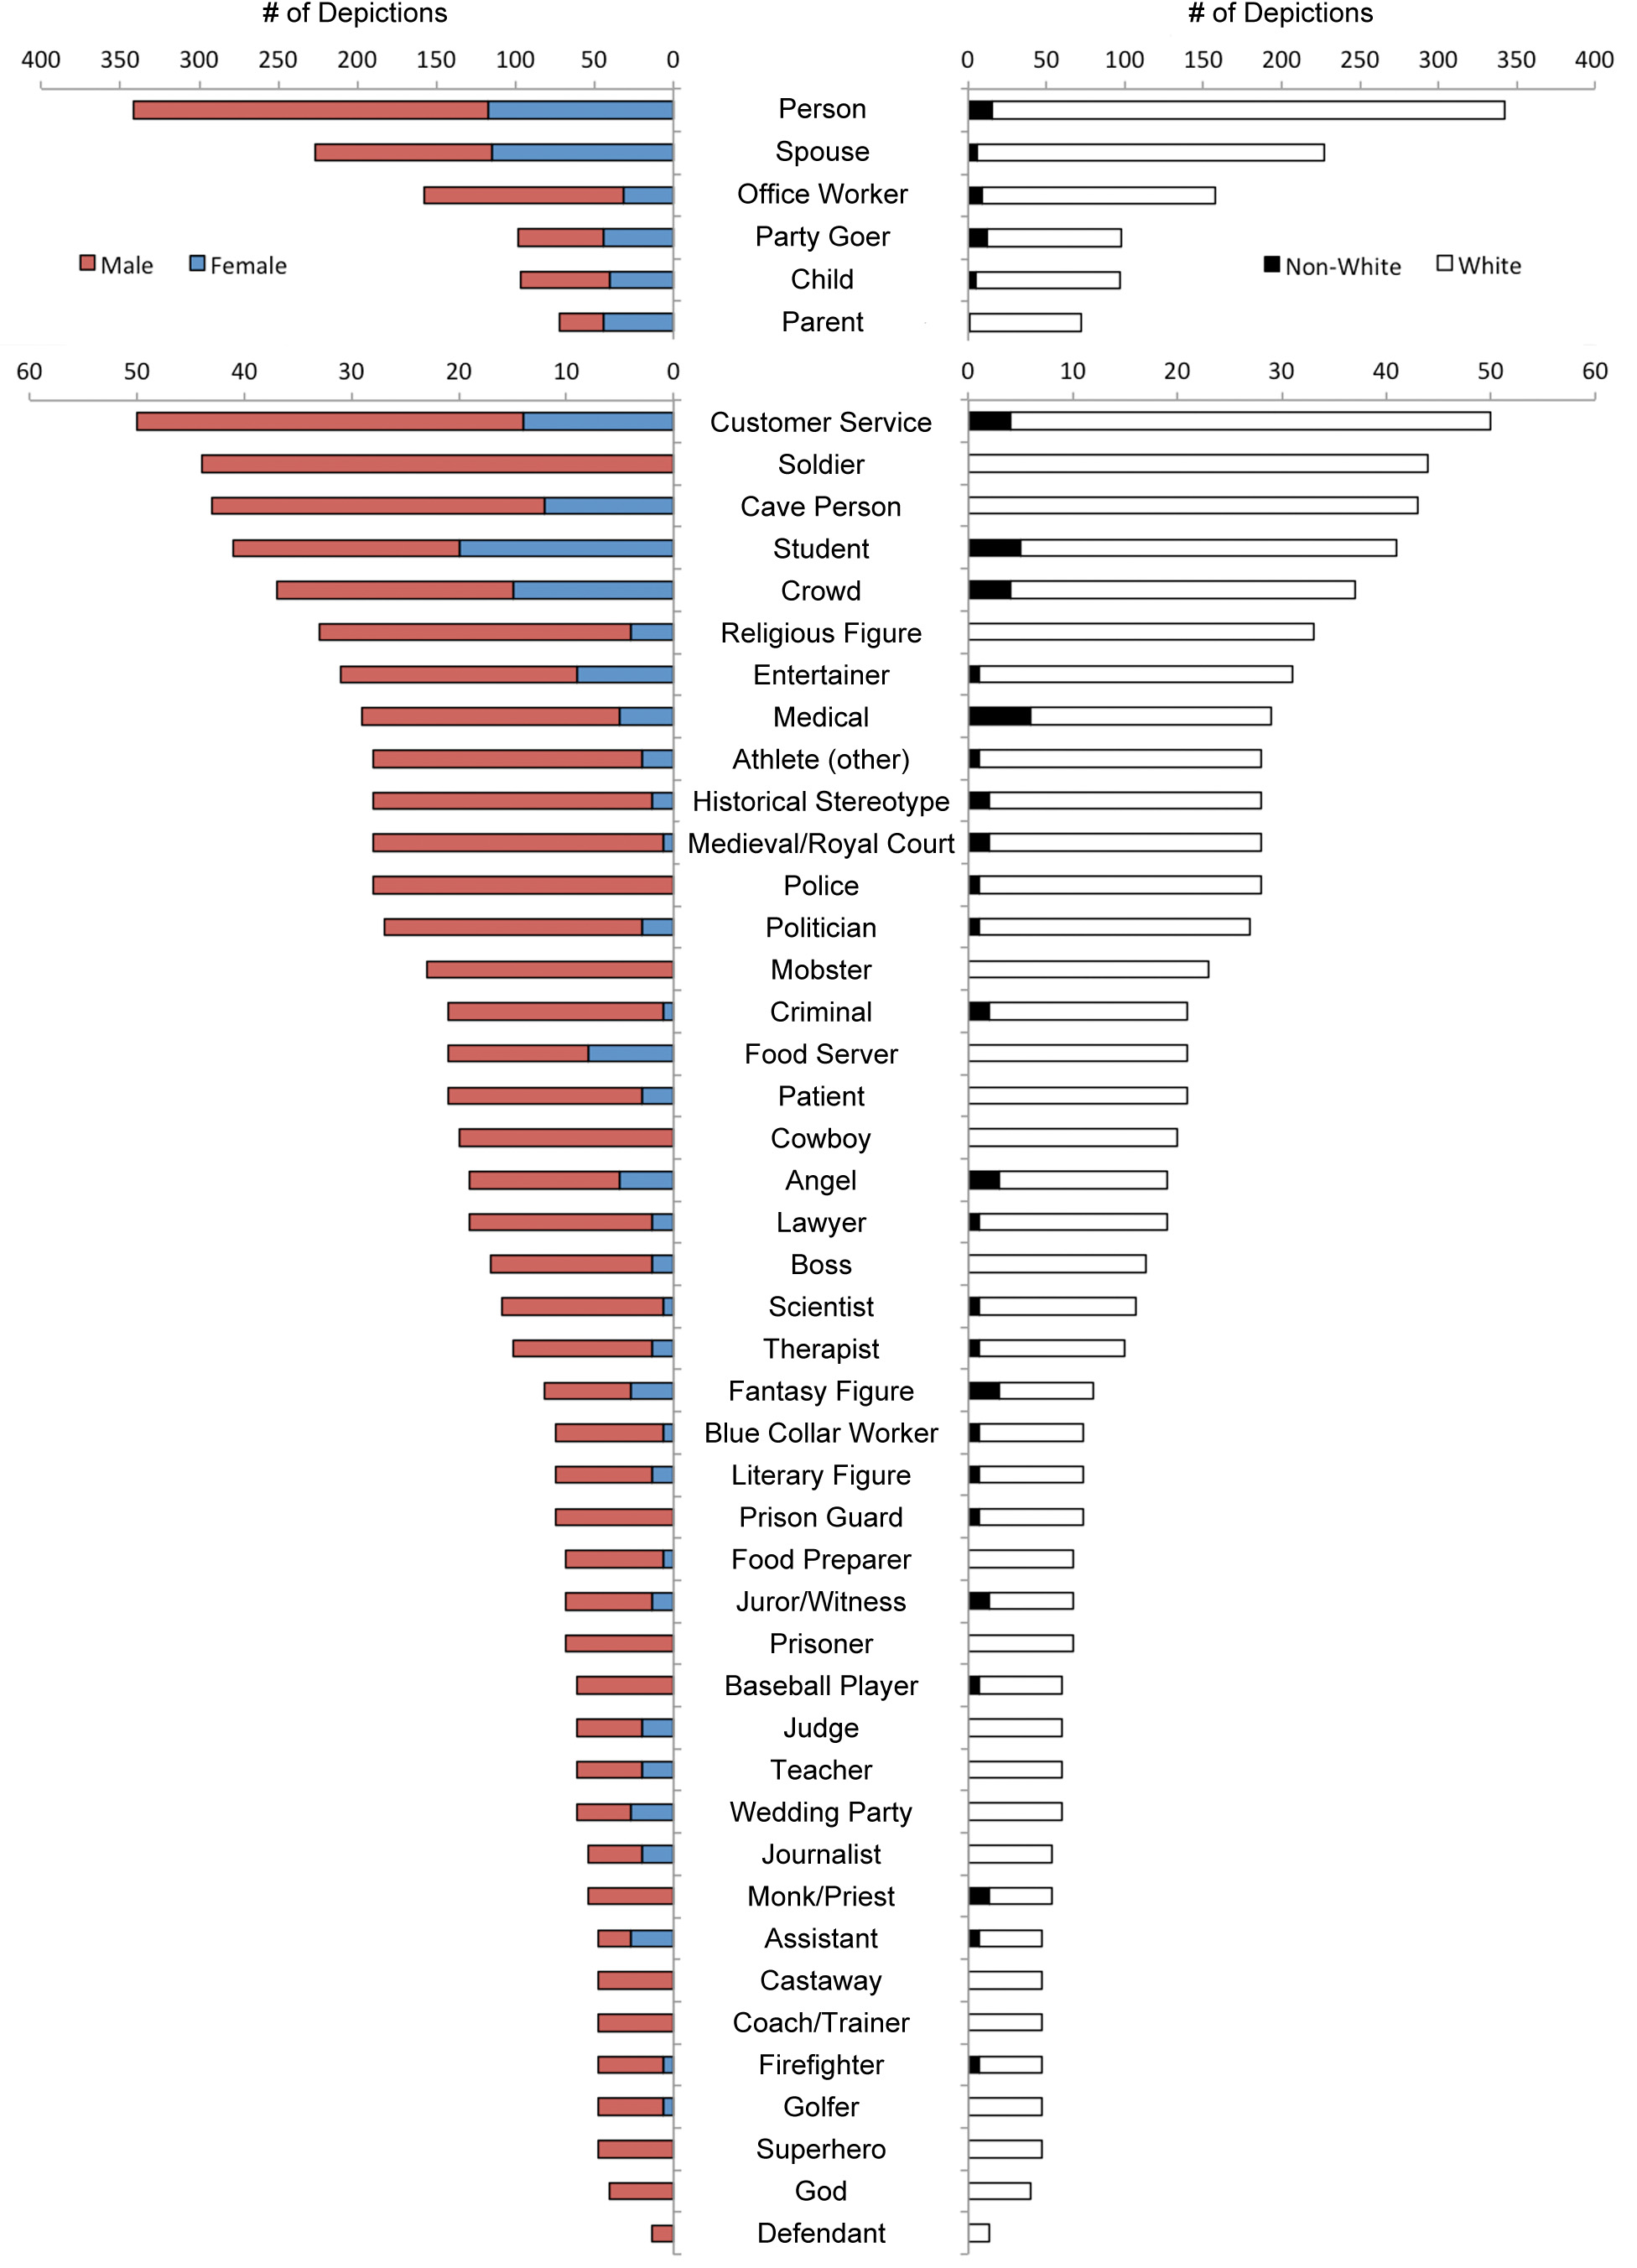
The largest category is Person, or basically a character we couldn’t find a good category for. The most common occupation turns out to be Office Worker. Five of the top six classifications (Person, Spouse, Party Goer, Child, Parent) have little if anything to do with work, suggesting that a lot of the humor in The New Yorker really does rely on our own personal relationships and non sequiturs (see here for an example), and not so much on work-related tropes (like, lawyer jokes).
It’s hard to see the breakdown of these classifications by Gender and Ethnicity, so we made another figure that shows it more clearly (Figure 2):
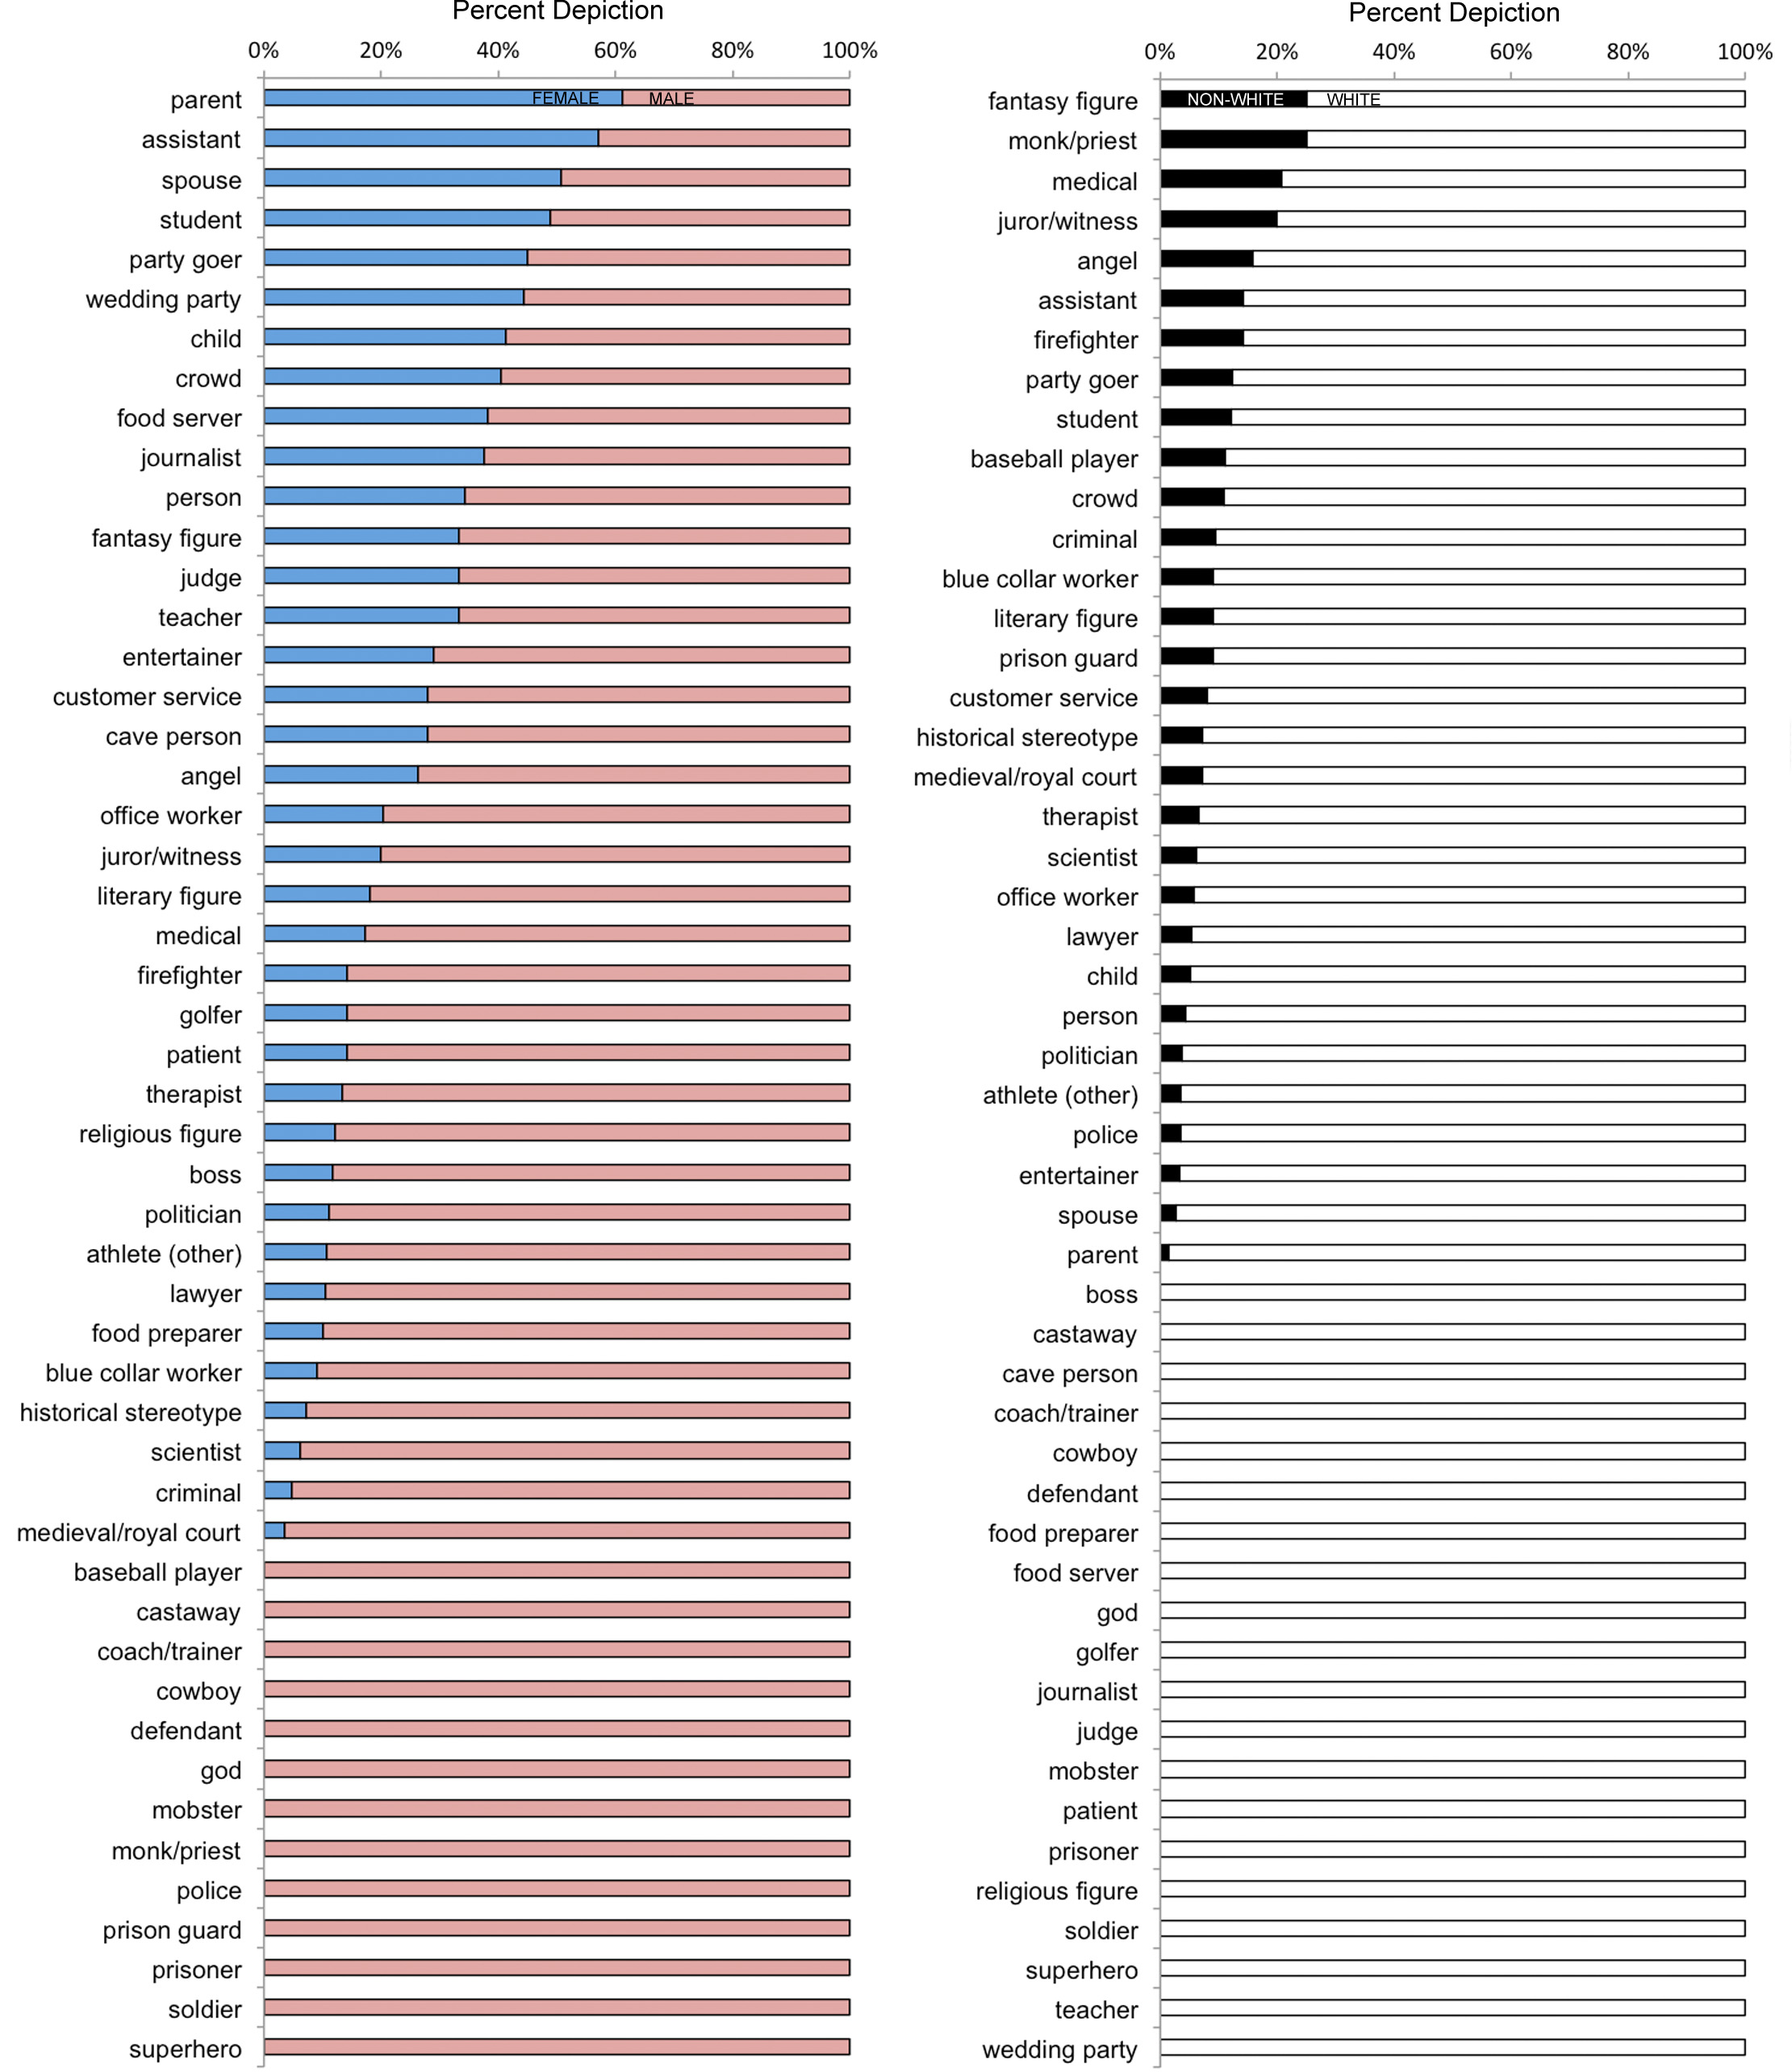
Females fared well mostly in non-occupational classifications, such as Parent, Spouse, Student, Party Goer, Wedding Party, Child, and Crowd. The only occupation in which females outnumbered males was Assistant (i.e., political aides and secretaries). Other occupations in which females made a strong showing were Food Server, Journalist, Judge, and Teacher [Side note about Food Servers: I challenge you to find a cartoon in The New Yorker with a female waiter at a nice restaurant or a male waiter at a cheap diner].
Non-whites never outnumbered whites in any character description. They had the best showing in Fantasy Figure (due to the many depictions of non-white wise men) and Monk/Priest (due solely to this cartoon). Non-whites did have a pretty strong showing in the Medical classification and even performed better there than females.
Thirteen of the fifty classifications had 0% female representation and twenty had 0% non-white representation, despite the fact that females and non-whites are representative in all such classifications in real life (depending on how you view Gods).
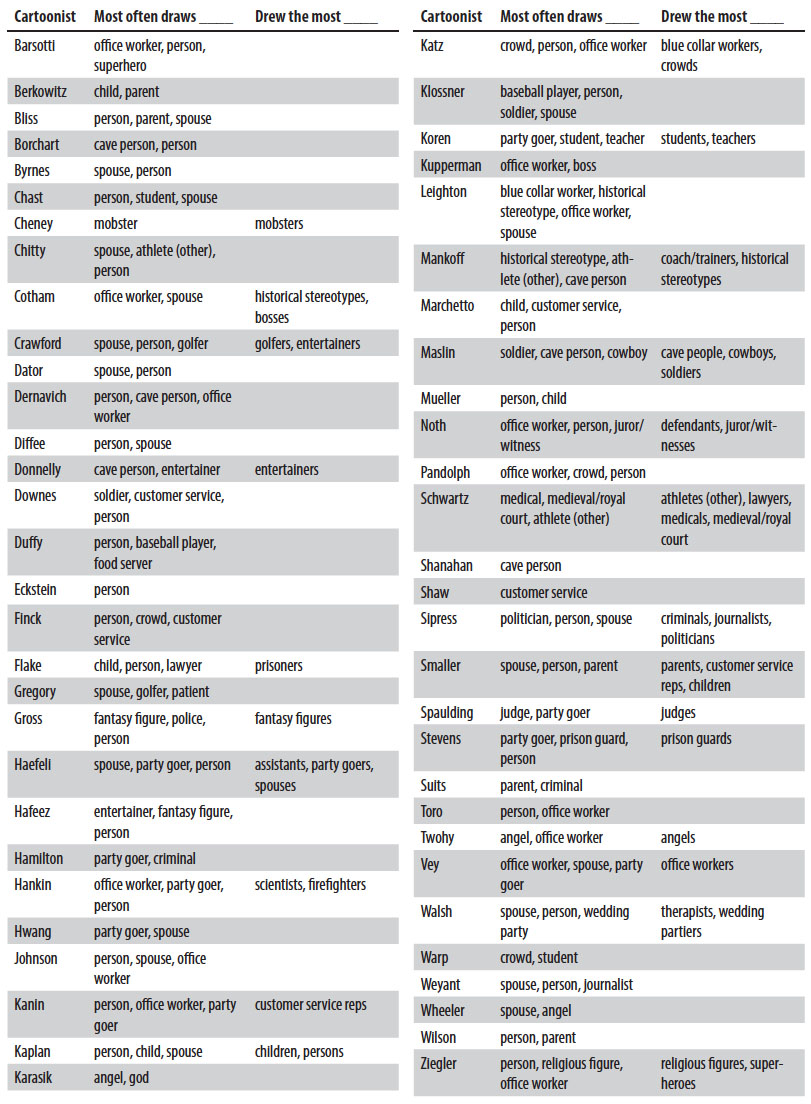
Breakdown by Cartoonist
We break down popular character descriptions by each cartoonist in Table 1. This table contains two columns for each cartoonist: one column showing the character descriptions drawn the most by each cartoonist and one column showing the character descriptions that that cartoonist had drawn more than any other cartoonist. For example, Emily Flake most often draws Children, Persons, and Lawyers in her cartoons and, in 2014, drew the most Prisoners of any other cartoonist. You might say she is the Patron Cartoonist of Prisoners.
In collecting the data by this project, we were struck by how often P.C. Vey draws office workers, and he is indeed the Patron Cartoonist of Office Workers. A published P.C. Vey cartoon has a 38% chance of containing at least one office worker.
Roz Chast, William Haefeli, Bruce Kaplan, and Barbara Smaller are the Masters of Non-Occupational Humor as most of their cartoons involve Parents, Spouses, Children, and Other Persons.
Paul Noth owns courtroom humor, Michael Maslin is the Ruler of Cave People, Cowboy, and Soldier humor, and Charlie Hankin and Avi Steinberg are the Co-Patron Cartoonists of Scientists.
We can also use this data to get an idea of how character-diverse each cartoonist is, as well as how specialized they are in a certain classification. To answer these questions, we borrow statistics from ecology. Ecologists use a handful of statistics to describe biodiversity in any given habitat. Species Richness is just the number of different species in the area. Species Diversity is an index that weights each species by its abundance (so habitats with an equal abundance of all species have high diversity). And Species Evenness measures how evenly distributed the abundance of species are (e.g., a value of 100% indicates that each species has the same abundance).
Each cartoonist can be considered as a habitat and each character classification can be considered as a species. So which cartoonist has the highest Species Diversity? That would be Paul Noth who drew 25 different character classifications. Close behind Noth are Ed Steed and Zachary Kanin (23 classifications each). These three cartoonists also have the highest Species Diversity (i.e., they drew each classification pretty equally), with David Sipress and Benjamin Schwartz rounding out the top 5.
Who was the most specialized cartoonist? That is, which cartoonist’s characters were dominated by one particular classification (i.e., lowest Species Evenness value)? Bruce Kaplan was the most specialized having drawn 54 total people but represented only 6 classifications. About 63% of his characters were classified as Person, just regular people. Also specialized were P.C. Vey (mostly Office Workers) and Roz Chast (mostly Persons).
Lastly, we get to the Jack-of-all-Trades cartoonist, the one depicting the most different types of classifications using the least amount of people. That would be Robert Leighton who drew only 14 people but had 10 different classifications.
Conclusions on the entire dataset
Trust us, you’ll never look at a cartoon from The New Yorker the same way.
We're also making this dataset publically available. Just click here.

Proceedings of the Natural Institute of Science (PNIS) by https://instsci.org/ is licensed under a Creative Commons Attribution-ShareAlike 4.0 International License.